The ongoing difficulties in overcoming the persistence of debt-to-GDP ratio in EU countries highlight the question whether the European Monetary Union can survive the set of shocks which prevailed since the 2008/2009 economic and financial crisis. Recently, European Commission has prested the 2010 review of public finances in EMU (link), suggesting that macroeconomic outlook for Eurozone economies has deteriorated in the light of a growing debt-to-GDP ratio.
The launch of government bailouts in various European countries has added considerable amount to the stock of public debt across the Eurozone. Since 2008/2009, general government balance in Eurozone countries has continually resulted in persistent government deficits which further added to the stock of debt. Since public debt is by definition the sum of previous deficits, the European macroeconomic outlook suffers significantly from downgraded stability of public debt.
The anatomy of sluggish economic recovery in Eurozone consists of different set of economic policies. Countries at the European periphery (Portugal, Ireland, Greece, Italy, Spain) seem to be hit most by the sluggish economic recovery. From the viewpoint of macreconomic stability, the economic policymakers in these countries have pursued the most discretionary economic policies to mitigate the effects of decline in GDP on employment, earnings and tax revenues. In addition, highly expansionary monetary policy by the European Central Bank provided a bulk of quantitative easing, resulting flooding liquidity to supplement the interbank lending and, hence, to contain the effect of overleveraged financial sector on macroeconomic stability. In Ireland, income per capita in 2010 notably decline back to 2004 level (link). As I previously emphasized in one of my previous posts (link), the depth of the economic crisis in Ireland is largely attributed to the overleveraged banking sector, vulnerable to the interbank interest rate increases. Since the sovereign CDS spread on Ireland exceeded 500 basis points in late September this year, the Irish public finance outlook deteriorated significantly in the light of the innate ability of the Irish government to bailout Anglo-Irish Bank. Recently, the IMF estimated (link) that by 2012, Irish debt-to-GDP ratio would reach 67 percent, up from 12 percent in 2005.
A prudent reduction in debt-to-GDP would be accomplished only under restrictive fiscal policy based on the reduction in government spending and a permanent fiscal rule on budget surplus at a given target level. If Irish government set the surplus target at 3 percent of GDP in the next ten years, debt-to-GDP ratio could be considerably reduced within the range of Maastricht fiscal criteria.
The macroeconomic outlook in peripheral countries suffers from high fiscal expenditures and rigid labor market institutions. By 2012, Portugal's debt-to-GDP ratio is expected to reach nearly 85 percent of GDP. In addition to soaring public debt, the Mediterranean part of the EMU suffers heavily from high unemployment rate. Eurostat recently reported that, by October 2010, the unemployment rate in Spain reached an astonishing 20.7 percent. Double-digit unemployment rate in Spain, Greece (12.2 percent) and Portugal (11 percent) hamper the economic recovery since, in the past, these countries exercised expansionary fiscal policy and the policy of automatic stabilizers to mitigate the effects of high unemployment on aggregate consumption decline. In the aftermath of financial crisis, these countries experienced recessionary output gap in which economic contraction is marred by unchanged inflationary pressures.
Since EMU countries withheld domestic currencies and adhered the adoption of the Euro, the macroeconomic adjustment to the recovery is possible only by a prudent fiscal policy. High unemployment rates and a persistent divergence of economic policies in EMU countries could substantially increase discretionary fiscal policies that would eventually result in the serious possibility of country default. The economic crisis in Greece resulted in 11 percent cumulative GDP decline between 2010 and 2012. In the same period, government net debt is expected to reach the 120 percent of GDP thresold. A divergence between Member States towards highly discretionary fiscal policy would probably alleviate the persistence of high unemployment but at the expense of bold increase in the rate of inflation as well as in the persistence of debt-to-GDP ratio and large government imbalances. Hence, the survival of the Eurozone would depend on the ability of EU Member States to adjust government balance by reducing fiscal expenditure and adopt the fiscal rule to pursue fiscal surplus in the coming years as to reduce the stock of public debt.
Even though a common fiscal policy could accomplish the goals of stabilization policy, the mitigation of fiscal asymmetries would be easily accomplished by labor market integration. A currency union between different countries implies integrated and assimilated labor markets under relatively homogenous preferences. It would be nearly impossible to envision the European Monetary Union without these key macroeconomic features.
Showing posts with label Economic Policy. Show all posts
Showing posts with label Economic Policy. Show all posts
Sunday, December 26, 2010


Tuesday, October 26, 2010
The economic future of Ireland
Following the beginning of the 2008/2009 economic and financial crisis, Ireland was hit by an unprecedent economic slowdown. In 2008, the GDP declined by 3.0 percent on the annual basis. In 2009, the GDP further declined by 7.1 percent in real terms. The unemployment rate increased to almost 12 percent.
Prior to the outburst of the economic crisis, Ireland enjoyed stable and predictable levels of public debt. In 2007, the country was known for having stabilised the public debt at 25 percent of the GDP - the lowest level of any Western European country. In 2009, the debt-to-GDP ratio increased to 64 percent of the GDP. Once known as the sick man of Europe, Ireland's economic policymakers have implemented a set of fiscal policy measures aimed to boost the long-term economic growth and abolish the economic policy based on the state intervention, high tax rates on labor and capital and export-led growth.
Eversince the 1960, Ireland pursued a soft version of industrial policy targeted at the promotion of inward foreign direct investment and the education of highly skilled workers. In addition, Ireland reduced the corporate income tax rate to 12.5 percent and provided a thorough technical assistance and to multinational companies located in Ireland. Indeed, U.S. multinationals such as Microsoft, Dell and Intel were encouraged to locate in Ireland mainly because of its geographic proximity to key European markets, skilled English-speaking workforce, membership in the EU, relative low wage level and favorable corporate taxation.
In early 1990s, the results of a precise set of economic policies were spectacular. By the end of 2006, the unemployment rate dropped to 4.6 percent from 18 percent in early 1980s. Between 1992 and 2005, Irish GDP increased by an average of 6.9 percent while the investment grew by 8.6 percent on the annual basis. The largest contribution to GDP growth was domestic demand (5.3 percentage point). Hence, Ireland's public finance enjoyed a favorable outlook mainly due to the rapid decline of debt-to-GDP ratio from 1980s onwards, and from a relatively low demographic pressure on the budgetary entitlements.
During the Irish boom, Irish banking and financial sector were highly dependant on the wholesale funding. Due to largely positive macroeconomic outlook from 1990 onwards, Irish banking sector received high and consistent credit ratings from agencies such as Moody, S&P and Fitch. In turn, the reliance on fragile wholesale funding resulted in overleveraged balance sheets. After the failure of Lehman Brothers in September 2008, the short-term outlook on Irish banking sector signalled a significant rise in credit-default swaps which raised concerns over the ability of banks to provide the wholesale funding for a mountain of short-term debt liabilities. And since the overleveraged balance sheets downgraded the outlook on Irish banking sector, the institutional investors demanded higher risk premium to extend the funding channel to the Irish banks.
The Directorate Generale for Economic and Financial Affairs of the European Commission downgraded the macroeconomic forecast of Irish GDP growth. By the end of 2009, the economic activity plummeted by 7.1 percent. The housing market crash was largely a result of the asset price bubble channeled through the overinvestment in the construction sector which represented 12 percent of the GDP. Nothing could explain the deflationary pressures in the aftermath of the financial crisis than excessive housing prices during the pre-crisis Irish economic boom. After 2008, Ireland's household savings rate increased to the level above 10 percent which is a result of the adjustment in the household balance sheet. In fact, between 2001 and 2007, the share of household debt in the GDP nearly doubled.
Meanwhile, the mountain of liabilities in the Irish banking and financial sector raised the concern over its solvency. The Irish Government immediately facilitated a bailout plan for the troubled banking sector. Consequently, the large budget deficit resulted in excessive debt-to-GDP ratio which grew by 39 percentage points between 2007 and 2009. In the annual European Economic Forecast (Spring, 2010), the European Commission estimated that by the end of 2011, the debt-to-GDP ratio could reach as high as 87.3 percent. while the cyclically-adjusted government balance is estimated to increase up to -10.2 percent of the GDP. The contraction of domestic demand which, by all measures, is the main engine of Ireland's economic growth led to a rapid increase in the unemployment rate which increase from 6.3 percent in 2008 to 11.9 percent in 2009. By 2011, the European Commission forecast that the unemployment rate is expected to further increase by 1.5 percentage point compared to 2009. In World Economic Outlook, the IMF estimated that the unemployment rate in Ireland would increase by 1.1 percentage point by the end of 2011. In 2009, Ireland experienced net outward migration for the first time since 1960s in the wake of expected 13.8 percent unemployment rate in 2010.
The macroeconomic forecast for 2011 is favorable. The European Commission upgraded GDP growth estimate to 3 percent. Meanwhile, the investment is expected to increase for the first time since the 60 percent cumulative decline of the construction sector. The positive contribution of net exports to the gradual narrowing of the current account deficit could be an important measure to alleviate the rising pressure over debt-to-GDP ratio. On the other hand, Ireland's Department of Finance revised the macroeconomic forecasts and estimated that by the end of this year, the GDP would grow by 1 percent on the annual basis.
The essential measure of Irish economic recovery is the retrenchment of wage rates in the public sector and the adjustment of public sector wages to the cyclical dynamics of economic activity to prevent the possibility of excessive inflationary pressures in the course of economic recovery. Current measures of retrenching public sector wages successfully anchored the inflationary expectations. According to the IMF, the annual inflation rate is estimated to peak at nearly 2 percent by the end of 2015. The falling wage rates in the private sector could induce the reallocation of resources in the tradeable sector, further adding to the contribution of net external trade to the GDP growth.
The key measures to alleviate the consequences of economic and financial crisis in both real and financial sector are the immediate narrowing of Ireland's excessive budget deficit and public debt in the share of GDP. High public debt is mainly the result of government capital injection into Anglo-Irish Bank which represents about 2 percentage points of net deficit increase in 2010. The entire consolidation package represents 2.5 percent of the GDP.
Deutsche Bank recently published Public Debt in 2020 and estimated the levels of public debt by the end of that year for both advanced and emerging-market economies. The analysis by Deutsche Bank predicted the effect of a combined negative shock in real interest rate, primary government balance and real GDP growth. If the combined shock of all three variables were to change by about one-fourth standard deviation from the estimated growth rate, the public debt in 2020 would reach 154 percent of the GDP. If the combined shock of all three variables increased by one-half standard deviation from the baseline estimates, the public debt in 2020 would increase to 197 percent of the GDP. The difference in the estimated increase is due to higher intensity of the combined shock. In addition, to restore the debt-to-GDP ratio to pre-crisis level, Ireland would be required to increase the primary government balance to 6 percent of the GDP.
Given the enormous magnitude and burden of public debt and overleveraged corporate and financial sector, the immediate facilitation of measures to alleviate the public indebtedness is necessary. Ireland's economic future is constrained by the persistence of budget deficit which adds to the future burden of public debt. Prudent efforts to reduce the burden of both debt and deficit are of the essential importance. Nevertheless, Irish policymakers should not neglect the economic policies that created the Irish miracle as well as the policy errors that caused the deepest economic decline in Western Europe during the 2008/2009 economic crisis.
Friday, September 10, 2010
CHINA'S GROWTH MODEL
According to some preliminary estimates (link), China's trade balance is on the course for a significant surplus this year. IMF's annual forecast of current account balance predicted China's trade surplus at $334 billion in 2010 or roughly 6.2 percent of China's GDP. The IMF's medium-term forecast suggests a growing trade surplus by 2015 when the surplus is estimated at a little more than 8 percent of GDP.
Recently, Dani Rodrik questioned (link) the persistence of China's mercantilism based on persistently low exchange rate. The partial fixation of the exchange rate then stimulates export-led growth model and, consequently, results in a large trade surplus which translates into foreign exchange reserves, thus enabling China's central bank to foster exchange rate intervention to defended the targeted yuan exchange rate against the U.S dollar. The implications of China's growth model extend beyond the scope of effects on country's economic growth, investment and current account balance. China's export-led growth model has tremendously affected the macroeconomic performance of developing nations. The exports of developing nations in the European, Japanese and U.S markets basically substitute, not complement, China's exports to the markets of advanced countries. The persistent lack of the appreciation of renmimbi thus forced the economic policymakers of other developing nations to either adopt the same model of exchange rate intervention or lose the export share in developing countries. This intuition is underlined by the theoretical and empirical support.
In 2007, Hausmann, Hwang and Rodrik demonstated (link) that the pattern of specialization by developing countries predicts the subsequent economic growth, suggesting that the share of exports in advanced countries is highly positively correlated with the rates of economic growth. If China shifted the main source of economic growth from export-led model to domestic consumption, the renmimbi would have to appreciate considerably. Contrary to the assertion that China's exchange rate undervaluation hampers the economic growth, industrialization and development prospects of developing nations, the OECD recently stated that developing countries would be hurt significantly if the renmimbi exchange rate were allowed to appreciate. There is also an empirical support for the particular assertion. The OECD recently estimated (link) that, if China's output grew by 1 percentage point, the output of developing countries would decrease by 0.3 percentage point.
The empirics supports the argument I mentioned earlier - China's exchange rate misalignment inevitably hinders the growth prospects and industrialization of developing countries. The essential question in the course of economic development is what is the best model of growth for developing countries to boost industrialization and development frontiers.
One possibility is the so called surplus model. Historically, growth models of low-income countries were primarily based on exporting natural resources to the rest of the world. Countries such as oil-rich gulf states, Botswana and Argentina became wealthy. Such growth model heavily depends on export demand in other countries. The most notable failure of this growth model is that it doesn't encourage the diversification of economic activity. Thus, countries such as Libya have sustained relatively high levels of GDP but, at the same time, rather depressing domestic indicators. For instance, Libya's GDP per capita is at almost the same level as Chile's GDP per capita, but Libya's unemployment rate is 30 percent - almost three times the average unemployment rate in countries with the same level of GDP per capita. When foreign demand deteriorates, these countries experience the Dutch disease - an overheating economic activity and overvalued exchange rates that discourage investment, entrepreneurship and typically result in higher unemployment rates.
Industrialization and economic development mostly depend on domestic structural change based on the adopting the institutions of macroeconomic stabilization and the rule of law. China's exchange rate policy of renmimbi undervaluation is a failed temporary growth model that is set on the unsustainable course. Without shifting the major engine of growth from export-boosting exchange rate undervaluation to consumption-based growth, Chinese economy will no longer be able to sustain high productivity growth rates. Letting the renmimbi appreciate by free floating could significantly boost the potential for institutional change in China and other developing nations. Therefore, the systemic abuse of macroeconomic policy by exchange rate undervaluation would no longer be feasible and the costs of failed exchange rate regime for developing countries would diminish substantially.
Recently, Dani Rodrik questioned (link) the persistence of China's mercantilism based on persistently low exchange rate. The partial fixation of the exchange rate then stimulates export-led growth model and, consequently, results in a large trade surplus which translates into foreign exchange reserves, thus enabling China's central bank to foster exchange rate intervention to defended the targeted yuan exchange rate against the U.S dollar. The implications of China's growth model extend beyond the scope of effects on country's economic growth, investment and current account balance. China's export-led growth model has tremendously affected the macroeconomic performance of developing nations. The exports of developing nations in the European, Japanese and U.S markets basically substitute, not complement, China's exports to the markets of advanced countries. The persistent lack of the appreciation of renmimbi thus forced the economic policymakers of other developing nations to either adopt the same model of exchange rate intervention or lose the export share in developing countries. This intuition is underlined by the theoretical and empirical support.
In 2007, Hausmann, Hwang and Rodrik demonstated (link) that the pattern of specialization by developing countries predicts the subsequent economic growth, suggesting that the share of exports in advanced countries is highly positively correlated with the rates of economic growth. If China shifted the main source of economic growth from export-led model to domestic consumption, the renmimbi would have to appreciate considerably. Contrary to the assertion that China's exchange rate undervaluation hampers the economic growth, industrialization and development prospects of developing nations, the OECD recently stated that developing countries would be hurt significantly if the renmimbi exchange rate were allowed to appreciate. There is also an empirical support for the particular assertion. The OECD recently estimated (link) that, if China's output grew by 1 percentage point, the output of developing countries would decrease by 0.3 percentage point.
The empirics supports the argument I mentioned earlier - China's exchange rate misalignment inevitably hinders the growth prospects and industrialization of developing countries. The essential question in the course of economic development is what is the best model of growth for developing countries to boost industrialization and development frontiers.
One possibility is the so called surplus model. Historically, growth models of low-income countries were primarily based on exporting natural resources to the rest of the world. Countries such as oil-rich gulf states, Botswana and Argentina became wealthy. Such growth model heavily depends on export demand in other countries. The most notable failure of this growth model is that it doesn't encourage the diversification of economic activity. Thus, countries such as Libya have sustained relatively high levels of GDP but, at the same time, rather depressing domestic indicators. For instance, Libya's GDP per capita is at almost the same level as Chile's GDP per capita, but Libya's unemployment rate is 30 percent - almost three times the average unemployment rate in countries with the same level of GDP per capita. When foreign demand deteriorates, these countries experience the Dutch disease - an overheating economic activity and overvalued exchange rates that discourage investment, entrepreneurship and typically result in higher unemployment rates.
Industrialization and economic development mostly depend on domestic structural change based on the adopting the institutions of macroeconomic stabilization and the rule of law. China's exchange rate policy of renmimbi undervaluation is a failed temporary growth model that is set on the unsustainable course. Without shifting the major engine of growth from export-boosting exchange rate undervaluation to consumption-based growth, Chinese economy will no longer be able to sustain high productivity growth rates. Letting the renmimbi appreciate by free floating could significantly boost the potential for institutional change in China and other developing nations. Therefore, the systemic abuse of macroeconomic policy by exchange rate undervaluation would no longer be feasible and the costs of failed exchange rate regime for developing countries would diminish substantially.
Friday, September 03, 2010
AUTHORITARIAN POLITICS AND ECONOMIC GROWTH
Dani Rodrik argues (link) that political dictatorship is damaging to economic growth since democracies not only outperformed countries with flawed political regimes in the dynamics of economic growth but also in terms of greater civil, economic and political liberties and investment in education that help enforce better public policies and yield better prospects of economic development.
"Democracies not only out-perform dictatorships when it comes to long-term economic growth, but also outdo them in several other important respects. They provide much greater economic stability, measured by the ups and downs of the business cycle. They are better at adjusting to external economic shocks (such as terms-of-trade declines or sudden stops in capital inflows). They generate more investment in human capital – health and education. And they produce more equitable societies."
"Democracies not only out-perform dictatorships when it comes to long-term economic growth, but also outdo them in several other important respects. They provide much greater economic stability, measured by the ups and downs of the business cycle. They are better at adjusting to external economic shocks (such as terms-of-trade declines or sudden stops in capital inflows). They generate more investment in human capital – health and education. And they produce more equitable societies."
Thursday, July 15, 2010
POVERTY, INCOME INEQUALITY AND ECONOMIC DEVELOPMENT
Financial Times reports (link) on the new measure of poverty proposed by economists from Oxford University. The authors suggested the modification of current measure of poverty which, defined by the World Bank in annually published World Development Report, is currently set at the thresold of $1.25 per day or less. The new measure proposed by economic researchers from Oxford University sets the definition of poverty in a more sophisticated framework based on the household availibility of access to clean water, education, health care and other durable and non-durable goods. The new method, called Alkire-Foster approach, incorporates the qualitative elements into the measurement of poverty.
Using the new method, the authors examined poverty rates in four Indian provinces and evaluated the approach in comparison to the existing income method which had been used in economic and policy analysis by the World Bank and other institutions of economic development. The authors found a significant divergence of poverty rates when measured in both methods. For instance, under Alkire-Foster approach, the poverty rate in Indian state Jharkhand is 50 percent higher compared to the rate of poverty measured under the income method. On the other hand, the authors of the new poverty measure have shown that in some Indian provinces such as Uttaranchal (link), the official measure of poverty highly over-estimates the effective poverty measure as defined by Oxford's Poverty and Human Development Initiative. The multidimensional worldwide poverty index is also availible on the web (link).
The intuitive question arising from the data and empirical research on poverty is whether higher economic growth in less developed countries boosts the growth of income per capita and what is the role of institutional characteristics in economic development. The authors of the abovementioned measure of poverty have shown that despite abundant economic growth in past years and falling income poverty rates, the share of population without access to clean water, sanitation and minimum required nutrition remained unchanged. The percentage of malnourished children in India decreased from 47 percent in 1998-98 to 46 percent 2005-06.
The theoretical and empirical literature on economic growth suggests that there is an inverse U-relationship between inequality and income per capita known as Kuznets curve (link). The intuition behind the relationship is simple. At the very low levels of income per capita, income inequality is low. Alongside the course of growing income per capita, income inequality steeply increases and, after reaching a maximum, it decreases as countries achieve higher levels of income per capita. The rate of income inequality is closely related to the evolution of economic policies over time. Wagner's law, discussed in one of the previous posts, states that government spending over time increases due to long-run income elastic demand for public goods and capture of the democratic system by the particular interest groups that pose a permanent pressure on the growth of government spending and resist the reversals of government expenditures by trading votes.
There's a wide array of disagreement among economists on the effect of income inequality on economic growth. Back in 2001, Joseph Stiglitz re-examined the East Asian economic miracle and concluded that the evidence from the period of high economic growth in East Asian countries suggests that income redistribution has a positive effect on economic growth (link). Stiglitz's argument is based on the income distribution in East Asian countries during the economic miracle. East Asian countries have been known for relatively even distribution of income demonstrated by high Gini index and relatively high income tax rates.
On the other hand, the empirical investigation of the initial conditions in East Asian countries before the economic miracle shows that the political influence of interest groups had been relatively weak compared to Western Europe after the World War 2 when the productivity growth stalled from early 1970s onwards. The relative weakness of interest groups and a stable judicial system, inherited from English common law tradition, enabled high economic growth in the longer run given an enduring stability of property rights protection and the rule of law. In such conditions, income redistribution had relatively little effect on economic growth since the empirics of East Asian miracle suggests that the sizeable proportion of growth in East Asian countries (Malaysia, Singapore, Korea and Taiwan) had been driven by technological progress, investment and export orientation. Considering export orientation, Rodrik et. al (2005) provided the evidence (link) on the positive effect of high-quality export orientation on economic growth. The productivity growth in East Asian countries between 1975 and 1990 had been a pure example of economic miracle defined by the share of growth that could not be explained by the contribution of labor and capital input. In Taiwan and Hong Kong (link), total factor productivity accounted for about 60 percent of output per capita growth. Between 1975 and 1990, in Singapore, output per capita had increased by 8.0 percent. Consequently, the resulting outcome of almost two decades of robust productivity growth had been a significant decrease in national poverty rates (link). The lowest poverty rate, as defined by the measures of home authorities, is in Taiwan where 0.95 of the population live below the poverty thresold.
The basic set of policies that alleviate extreme poverty such as providing access to clean water, nutrition, medical protection against HIV/AIDS and basic sanitary standards have a positive effect on the economic growth and the standard of living. However, the major cause of persistent under-development in Subsaharan and Tropical Africa is mostly the lack of institutional enforcement of property rights, the rule of law and independent judiciary. In spite of billions of USD of direct foreign aid, countries such as Zambia, Sierra Leone, Mali and Rwanda endure in persistent poverty and under-development. Esther Duflo, this year's recepient of John Bates Clark Award, has shown in several studies how field experiments can enlighten the understanding of incentives in least developed countries (link). Understanding the significance of incentives in reducing poverty is crucial to further examination of the relationship betwen income inequality and economic growth.
Using the new method, the authors examined poverty rates in four Indian provinces and evaluated the approach in comparison to the existing income method which had been used in economic and policy analysis by the World Bank and other institutions of economic development. The authors found a significant divergence of poverty rates when measured in both methods. For instance, under Alkire-Foster approach, the poverty rate in Indian state Jharkhand is 50 percent higher compared to the rate of poverty measured under the income method. On the other hand, the authors of the new poverty measure have shown that in some Indian provinces such as Uttaranchal (link), the official measure of poverty highly over-estimates the effective poverty measure as defined by Oxford's Poverty and Human Development Initiative. The multidimensional worldwide poverty index is also availible on the web (link).
The intuitive question arising from the data and empirical research on poverty is whether higher economic growth in less developed countries boosts the growth of income per capita and what is the role of institutional characteristics in economic development. The authors of the abovementioned measure of poverty have shown that despite abundant economic growth in past years and falling income poverty rates, the share of population without access to clean water, sanitation and minimum required nutrition remained unchanged. The percentage of malnourished children in India decreased from 47 percent in 1998-98 to 46 percent 2005-06.
The theoretical and empirical literature on economic growth suggests that there is an inverse U-relationship between inequality and income per capita known as Kuznets curve (link). The intuition behind the relationship is simple. At the very low levels of income per capita, income inequality is low. Alongside the course of growing income per capita, income inequality steeply increases and, after reaching a maximum, it decreases as countries achieve higher levels of income per capita. The rate of income inequality is closely related to the evolution of economic policies over time. Wagner's law, discussed in one of the previous posts, states that government spending over time increases due to long-run income elastic demand for public goods and capture of the democratic system by the particular interest groups that pose a permanent pressure on the growth of government spending and resist the reversals of government expenditures by trading votes.
There's a wide array of disagreement among economists on the effect of income inequality on economic growth. Back in 2001, Joseph Stiglitz re-examined the East Asian economic miracle and concluded that the evidence from the period of high economic growth in East Asian countries suggests that income redistribution has a positive effect on economic growth (link). Stiglitz's argument is based on the income distribution in East Asian countries during the economic miracle. East Asian countries have been known for relatively even distribution of income demonstrated by high Gini index and relatively high income tax rates.
On the other hand, the empirical investigation of the initial conditions in East Asian countries before the economic miracle shows that the political influence of interest groups had been relatively weak compared to Western Europe after the World War 2 when the productivity growth stalled from early 1970s onwards. The relative weakness of interest groups and a stable judicial system, inherited from English common law tradition, enabled high economic growth in the longer run given an enduring stability of property rights protection and the rule of law. In such conditions, income redistribution had relatively little effect on economic growth since the empirics of East Asian miracle suggests that the sizeable proportion of growth in East Asian countries (Malaysia, Singapore, Korea and Taiwan) had been driven by technological progress, investment and export orientation. Considering export orientation, Rodrik et. al (2005) provided the evidence (link) on the positive effect of high-quality export orientation on economic growth. The productivity growth in East Asian countries between 1975 and 1990 had been a pure example of economic miracle defined by the share of growth that could not be explained by the contribution of labor and capital input. In Taiwan and Hong Kong (link), total factor productivity accounted for about 60 percent of output per capita growth. Between 1975 and 1990, in Singapore, output per capita had increased by 8.0 percent. Consequently, the resulting outcome of almost two decades of robust productivity growth had been a significant decrease in national poverty rates (link). The lowest poverty rate, as defined by the measures of home authorities, is in Taiwan where 0.95 of the population live below the poverty thresold.
The basic set of policies that alleviate extreme poverty such as providing access to clean water, nutrition, medical protection against HIV/AIDS and basic sanitary standards have a positive effect on the economic growth and the standard of living. However, the major cause of persistent under-development in Subsaharan and Tropical Africa is mostly the lack of institutional enforcement of property rights, the rule of law and independent judiciary. In spite of billions of USD of direct foreign aid, countries such as Zambia, Sierra Leone, Mali and Rwanda endure in persistent poverty and under-development. Esther Duflo, this year's recepient of John Bates Clark Award, has shown in several studies how field experiments can enlighten the understanding of incentives in least developed countries (link). Understanding the significance of incentives in reducing poverty is crucial to further examination of the relationship betwen income inequality and economic growth.
Wednesday, June 16, 2010
THE EMPIRICAL EVIDENCE ON WAGNER'S LAW
Ever since the original proposition by a 19th century German economist Adolph Wagner, Wagner's law has undergone significant theoretical and empirical discussion on its long-run validity. In the most basic and rudimentary version, the law states that alongside the economic development of industrial societies, there is a persistent tendency of an increasing share of government spending in the GDP. Since the beginning of the 20th century course, the growth in government expenditures has escalated in all major industrial countries. The economic literature has centered the discussion on two elementary versions of Wagner's law. The first version of Wagner's law attributes the growing share of government spending to the ever expanding power of interest groups.
The concept of interest groups has been thoroughly developed by a rigorous theoretical analysis by Mancur Olson's The Logic of Collective Action. There is a remarkably positive correlation between the growth of government spending and the political power of interest groups. Back in 1954, Milton Friedman and Simon Kuznets have analyzed the income dynamics in independent professions (link). Although there has not been much discussion in the economic literature, the Friedman-Kuznets analysis is an important milestone in the explanation of the evolution of interest groups. Friedman and Kuznets examined five independent professions. Using a comprehensive statistical analysis, they showed how income growth in five profession has exerted an upward trend without significant gains in productivity. The five independent professions analyzed by Friedman and Kuznets emerged as pure interest groups. These groups have imposed a regulated labor market structure marred by occupational licencing and aimed at gaining an insider's earnings rent at the expense of entry restriction. Occupational licensing is one of the most powerful explanatory features of low coefficient of price and income elasticity of labor supply of physicians, dentists, legal consultants and medical practitioners. In most of the industrial countries, these groups have emerged as powerful interest groups and triggered an unbreakable increase on the growth of government spending. The evolution of interest groups in fields such as agriculture, social security and trade has resulted in the intensive pressure on the growth of government spending. The interest group perspective on Wagner's law emphasizes the state capture created by the democratic system and an irreversible pattern of increases in government spending centered on small and powerful interest groups. If interest group's representative utility function can be described as a relationship between the group's size and its price elasticity of labor supply: U(f,e)=f(1-|e|), then the effect of a unit change in price elasticity of labor supply dU/de=-f indicates that greater price elasticity of labor supply will reduce the size (f) of the interest group as a result of pure substitution effect at work. On the other hand, if price elasticity of labor supply of the particular interest group will decrease, causing more price inelastic labor supply, the size of the interest group will increase since most of the excess wage increases will spill into physician's pocket.
The second version of Wagner's law states that an increase in government spending in time is a result of a high income elasticity of demand for public goods. Rati Ram (1986) has tested this hypothesis on the sample of 115 countries between 1950 and 1980. His conclusions suggest that income elasticity of demand for public goods is very elastice (exceeding 1) in 60 percent of all countries in the sample. A comprehensive development of econometric methodology has enabled a more rigorous and empirical evaluation of Wagner's law on the basis of long-run simulation using time-series data. For example Sidelis (2006) has applied cointegration analysis and Granger casuality tests to determine whether long-run changes in income account for the growth of government spending in Greece between 1833 and 1938 (link). The author concludes that income elastic demand for public goods caused a growth in government expenditures. A recent study by Lamartina and Zaghini (2008) indicates (link) a negative relationship between government spending and economic growth in a sample of 23 OECD countries. The study further suggests that the correlation between income growth and government expenditure is stronger in countries with low initial levels of GDP per capita. Neck and Getzner (2007) collected data on government expenditure in Austria between 1870 and 2002 and examined whether the surge of government expenditure is attributed to either Wagner's law or Baumol's cost disease. The authors applied Phillipe-Perron and Augmented Dickey-Fuller stationarity tests, concluding that government spending time series more likely represents a stationary time series. In concluding remarks, the authors note that much of the increase in government expenditure is a problem of increasing prices in public sector, relating the growth in public expenditures to Baumol's cost disease where output reduction in public sector is a result of net decrease in productivity growth which yields a significant pressure from public sector interest groups on expenditure increases.
Wagner's law is an intriguing theoretical and empirical issue. In spite of the numerous empirical evaluation and theoretical design, the issue will probably remain an intensive course of the academic debate.
The concept of interest groups has been thoroughly developed by a rigorous theoretical analysis by Mancur Olson's The Logic of Collective Action. There is a remarkably positive correlation between the growth of government spending and the political power of interest groups. Back in 1954, Milton Friedman and Simon Kuznets have analyzed the income dynamics in independent professions (link). Although there has not been much discussion in the economic literature, the Friedman-Kuznets analysis is an important milestone in the explanation of the evolution of interest groups. Friedman and Kuznets examined five independent professions. Using a comprehensive statistical analysis, they showed how income growth in five profession has exerted an upward trend without significant gains in productivity. The five independent professions analyzed by Friedman and Kuznets emerged as pure interest groups. These groups have imposed a regulated labor market structure marred by occupational licencing and aimed at gaining an insider's earnings rent at the expense of entry restriction. Occupational licensing is one of the most powerful explanatory features of low coefficient of price and income elasticity of labor supply of physicians, dentists, legal consultants and medical practitioners. In most of the industrial countries, these groups have emerged as powerful interest groups and triggered an unbreakable increase on the growth of government spending. The evolution of interest groups in fields such as agriculture, social security and trade has resulted in the intensive pressure on the growth of government spending. The interest group perspective on Wagner's law emphasizes the state capture created by the democratic system and an irreversible pattern of increases in government spending centered on small and powerful interest groups. If interest group's representative utility function can be described as a relationship between the group's size and its price elasticity of labor supply: U(f,e)=f(1-|e|), then the effect of a unit change in price elasticity of labor supply dU/de=-f indicates that greater price elasticity of labor supply will reduce the size (f) of the interest group as a result of pure substitution effect at work. On the other hand, if price elasticity of labor supply of the particular interest group will decrease, causing more price inelastic labor supply, the size of the interest group will increase since most of the excess wage increases will spill into physician's pocket.
The second version of Wagner's law states that an increase in government spending in time is a result of a high income elasticity of demand for public goods. Rati Ram (1986) has tested this hypothesis on the sample of 115 countries between 1950 and 1980. His conclusions suggest that income elasticity of demand for public goods is very elastice (exceeding 1) in 60 percent of all countries in the sample. A comprehensive development of econometric methodology has enabled a more rigorous and empirical evaluation of Wagner's law on the basis of long-run simulation using time-series data. For example Sidelis (2006) has applied cointegration analysis and Granger casuality tests to determine whether long-run changes in income account for the growth of government spending in Greece between 1833 and 1938 (link). The author concludes that income elastic demand for public goods caused a growth in government expenditures. A recent study by Lamartina and Zaghini (2008) indicates (link) a negative relationship between government spending and economic growth in a sample of 23 OECD countries. The study further suggests that the correlation between income growth and government expenditure is stronger in countries with low initial levels of GDP per capita. Neck and Getzner (2007) collected data on government expenditure in Austria between 1870 and 2002 and examined whether the surge of government expenditure is attributed to either Wagner's law or Baumol's cost disease. The authors applied Phillipe-Perron and Augmented Dickey-Fuller stationarity tests, concluding that government spending time series more likely represents a stationary time series. In concluding remarks, the authors note that much of the increase in government expenditure is a problem of increasing prices in public sector, relating the growth in public expenditures to Baumol's cost disease where output reduction in public sector is a result of net decrease in productivity growth which yields a significant pressure from public sector interest groups on expenditure increases.
Wagner's law is an intriguing theoretical and empirical issue. In spite of the numerous empirical evaluation and theoretical design, the issue will probably remain an intensive course of the academic debate.
Tuesday, April 20, 2010
EU vs. USA
I published a brief analysis (link) for the European Enterprise Institute, discussing a pattern of a growing income differential between the EU and America. The financial crisis diminished European growth rates and further widened the economic gap between the two continents.
Given a weak economic outlook for EU countries, the gap between European Union and the United States is likely to widen in the next decade although the US economy will be restrained by high tax burden and a growing federal debt. In 2010, I estimated the gap between the US and EU15 at 35-40 years, depending on EU's growth scenario.
Given a weak economic outlook for EU countries, the gap between European Union and the United States is likely to widen in the next decade although the US economy will be restrained by high tax burden and a growing federal debt. In 2010, I estimated the gap between the US and EU15 at 35-40 years, depending on EU's growth scenario.
Sunday, April 11, 2010
VALUE-ADDED TAX FOR AMERICA?
Dan Mitchell wrote an interesting op-ed in NY Post (link) concerning the prospects of adopting a European-style value-added tax (VAT) in the United States.
Imposing a VAT would be detrimental to economic growth and productivity performance. If the U.S imposed the VAT, its spending levels would quickly approach the European spending levels. Indeed, the VAT is already used by OECD nations. In European Union, European Commission's Directive requires each country to harmonize value-added tax rate at the level of at least 15 percent. Federal spending in the U.S has already escalated. The consequence of $787 billion of stimulus measures is high public debt. Congressional Budget Office has forecasted the public debt to approach 70 percent of the GDP by 2012 and remain constant until 2020 (link). Rising costs of health care, entitlement spending and aging population have triggered government spending (link) and tax burden on the U.S firms and households. By 2020, health care spending is expected to reach 20 percent of the U.S GDP (link). Historical figures suggest a rather glimmering fiscal scenario for the United States in the next decade. In 1965, before the VAT spread across the European community, average tax burden of EU15 reached 27.7 percent of the GDP versus 24.7 percent in America. In 2006, the average tax burden for 15 developed European countries reached 39.8 percent. In United States, where VAT has not been introduced, average tax burden in 2006 remained close to the level of 1960s - at 28 percent of the GDP. The immediate consequence of VAT introduction in Europe was a surge in government spending. From 1965 to 2006, average government spending (as a share of the GDP) in the European Union increased by 17 percentage points while in America it increased by 7 percentage points. The total increase of spending growth in Europe and America is attributed to the widespread growth of the welfare state which includes entitlement spending and a growing cost of health care.
The economics of tax system is pretty straightforward. Alan Viard of the American Enterprise Institute (link) has outlined basic features of the VAT system. Contrary to the income tax system, VAT is a consumption tax. From the economic perspective, consumption tax is less distorting to economic behavior than the income tax. A pure VAT is tax at each stage of the supply chain. The taxation of individual income is a major distortion mostly because the source of direct taxation is labor supply. Introducing a tax on labor supply creates the so-called substitution effect where lower wage (w'=w(1-t)) is offset by a decrease in working hours and an increase in leisure hours either in pure leisure time or working more in household production or in the informal sector of the economy. Higher tax wedge in net wages has been the major factor behind fewer working hours in slow-growth European countries (Italy, France, Germany, Belgium etc.). The VAT is not as damaging as the income tax since the tax rate on individual consumption is applied when the income is already earned, so that income earning is not distorted. From a pure economic perspective, consumption taxation is more appropriate than income taxation mostly because the price elasticity of consumption goods is lower than price elasticity of labor supply. The consumption tax is based on the so-called Ramsey rule which states that the optimal tax rate is the inverse of the price elasticity of demand for a particular good ((t*=1/-dQ/dP*(P/Q)). It follows that on consumption goods with lower elasticity of demand, higher tax rate should be applied since the deadweight loss is smaller than in consumption goods with high price elasticity of demand. For example, price elasticity of demand is very low in goods such as gasoline since there's no close substitutes to gasoline. On the other hand, the elasticity of demand is pretty high in goods such as Big Mac or Coca Cola since there's a lot of substitutes for these goods (Subway snacks, Pepsi etc.) and a tax rate on Big Mac or Coca Cola can easily divert consumers to consume more Subway snacks, Pepsi or other goods.
While the introduction of a VAT is less income-distorting than a direct income tax, the imposition of both tax structures is a negative effect on economic growth, productivity and employment. Aside from the harmful taxation of income, the introduction of the VAT would further hamper individual consumption, raise consumer and producer prices and harm the manufacturing activity. One advantage of the VAT is a low cost and easy way of raising revenue. In economic theory, a uniform consumption tax is preferable to the income tax mostly due to fewer distortion in generating income which is the key feature of economic growth. A VAT also avoids imposing additional penalizing disincetives to labor supply and productivity.
Congressional Budget Office (link) has recently released Budget Outlook 2010, in which it laid out future perspectives of America's fiscal policy. Assuming an exerting pressure of tax burden in the coming years, the CBO has predicted the individual income taxes to grow from 6.4 percent in 2009 to 10.9 percent of the GDP by 2020. Imposing a VAT on top of the existing income tax would further reduce real disposable income and individual consumption. If a VAT were implemented on the federal or state level, there would be a significant and immediate increase in effective tax rates. The evolution of federal effective tax rates from 1970 to 2001 (link) shows a trend of decreasing effective tax rates and a growing after-tax income in all income quintiles.
The introduction of a VAT would dramatically change the US fiscal map. An article from OECD Observer (link) shows a comparative tax revenue distribution for the U.S, Europe and Japan. Back in 1999, the U.S was the only global economic giant with tax revenue from goods and service taxation of less than 30 percent of all tax revenues. The share remained steady until now. The non-existence of the VAT in America has contained the growth of overall tax burden. In 2004, total government revenues were 32 percent of the US GDP, far below the shares of high-tax countries. In Sweden, government revenue presented 59 percent of the GDP. While the U.S tax burden, measured as a share of government revenue in GDP, stayed below the level of France (50 percent), Germany (43 percent), Italy (45 percent), the introduction of a VAT may quickly turn America into a European-style country with high tax burden and benign economic growth. The international data (link) on total tax revenue in 2007 show that total tax revenue in the U.S presented 28.3 percent of the GDP. In 2007, taxes on goods and services presented about 4.7 percent of the US GDP; about three times less the level in Sweden (12.9 percent of the GDP) and four times less the level in Denmark (16.3 percent of the GDP). If a revenue from a VAT captured approximately 9.5 percent of the US GDP, America's tax revenue from a VAT would present about 14.2 percent of the GDP (9.5+4.7=14.2) comparable with high-tax countries such as Finland, Austria or Belgium and even more than in France.
Although the VAT is an easily applied method of taxing general consumption, imposing a VAT on the federal and state level would seriously harm America's future growth, investment, personal consumption, manufacturing activity and productivity. It would make America look like a typical slow-growth European welfare state for the first time.
Imposing a VAT would be detrimental to economic growth and productivity performance. If the U.S imposed the VAT, its spending levels would quickly approach the European spending levels. Indeed, the VAT is already used by OECD nations. In European Union, European Commission's Directive requires each country to harmonize value-added tax rate at the level of at least 15 percent. Federal spending in the U.S has already escalated. The consequence of $787 billion of stimulus measures is high public debt. Congressional Budget Office has forecasted the public debt to approach 70 percent of the GDP by 2012 and remain constant until 2020 (link). Rising costs of health care, entitlement spending and aging population have triggered government spending (link) and tax burden on the U.S firms and households. By 2020, health care spending is expected to reach 20 percent of the U.S GDP (link). Historical figures suggest a rather glimmering fiscal scenario for the United States in the next decade. In 1965, before the VAT spread across the European community, average tax burden of EU15 reached 27.7 percent of the GDP versus 24.7 percent in America. In 2006, the average tax burden for 15 developed European countries reached 39.8 percent. In United States, where VAT has not been introduced, average tax burden in 2006 remained close to the level of 1960s - at 28 percent of the GDP. The immediate consequence of VAT introduction in Europe was a surge in government spending. From 1965 to 2006, average government spending (as a share of the GDP) in the European Union increased by 17 percentage points while in America it increased by 7 percentage points. The total increase of spending growth in Europe and America is attributed to the widespread growth of the welfare state which includes entitlement spending and a growing cost of health care.
The economics of tax system is pretty straightforward. Alan Viard of the American Enterprise Institute (link) has outlined basic features of the VAT system. Contrary to the income tax system, VAT is a consumption tax. From the economic perspective, consumption tax is less distorting to economic behavior than the income tax. A pure VAT is tax at each stage of the supply chain. The taxation of individual income is a major distortion mostly because the source of direct taxation is labor supply. Introducing a tax on labor supply creates the so-called substitution effect where lower wage (w'=w(1-t)) is offset by a decrease in working hours and an increase in leisure hours either in pure leisure time or working more in household production or in the informal sector of the economy. Higher tax wedge in net wages has been the major factor behind fewer working hours in slow-growth European countries (Italy, France, Germany, Belgium etc.). The VAT is not as damaging as the income tax since the tax rate on individual consumption is applied when the income is already earned, so that income earning is not distorted. From a pure economic perspective, consumption taxation is more appropriate than income taxation mostly because the price elasticity of consumption goods is lower than price elasticity of labor supply. The consumption tax is based on the so-called Ramsey rule which states that the optimal tax rate is the inverse of the price elasticity of demand for a particular good ((t*=1/-dQ/dP*(P/Q)). It follows that on consumption goods with lower elasticity of demand, higher tax rate should be applied since the deadweight loss is smaller than in consumption goods with high price elasticity of demand. For example, price elasticity of demand is very low in goods such as gasoline since there's no close substitutes to gasoline. On the other hand, the elasticity of demand is pretty high in goods such as Big Mac or Coca Cola since there's a lot of substitutes for these goods (Subway snacks, Pepsi etc.) and a tax rate on Big Mac or Coca Cola can easily divert consumers to consume more Subway snacks, Pepsi or other goods.
While the introduction of a VAT is less income-distorting than a direct income tax, the imposition of both tax structures is a negative effect on economic growth, productivity and employment. Aside from the harmful taxation of income, the introduction of the VAT would further hamper individual consumption, raise consumer and producer prices and harm the manufacturing activity. One advantage of the VAT is a low cost and easy way of raising revenue. In economic theory, a uniform consumption tax is preferable to the income tax mostly due to fewer distortion in generating income which is the key feature of economic growth. A VAT also avoids imposing additional penalizing disincetives to labor supply and productivity.
Congressional Budget Office (link) has recently released Budget Outlook 2010, in which it laid out future perspectives of America's fiscal policy. Assuming an exerting pressure of tax burden in the coming years, the CBO has predicted the individual income taxes to grow from 6.4 percent in 2009 to 10.9 percent of the GDP by 2020. Imposing a VAT on top of the existing income tax would further reduce real disposable income and individual consumption. If a VAT were implemented on the federal or state level, there would be a significant and immediate increase in effective tax rates. The evolution of federal effective tax rates from 1970 to 2001 (link) shows a trend of decreasing effective tax rates and a growing after-tax income in all income quintiles.
The introduction of a VAT would dramatically change the US fiscal map. An article from OECD Observer (link) shows a comparative tax revenue distribution for the U.S, Europe and Japan. Back in 1999, the U.S was the only global economic giant with tax revenue from goods and service taxation of less than 30 percent of all tax revenues. The share remained steady until now. The non-existence of the VAT in America has contained the growth of overall tax burden. In 2004, total government revenues were 32 percent of the US GDP, far below the shares of high-tax countries. In Sweden, government revenue presented 59 percent of the GDP. While the U.S tax burden, measured as a share of government revenue in GDP, stayed below the level of France (50 percent), Germany (43 percent), Italy (45 percent), the introduction of a VAT may quickly turn America into a European-style country with high tax burden and benign economic growth. The international data (link) on total tax revenue in 2007 show that total tax revenue in the U.S presented 28.3 percent of the GDP. In 2007, taxes on goods and services presented about 4.7 percent of the US GDP; about three times less the level in Sweden (12.9 percent of the GDP) and four times less the level in Denmark (16.3 percent of the GDP). If a revenue from a VAT captured approximately 9.5 percent of the US GDP, America's tax revenue from a VAT would present about 14.2 percent of the GDP (9.5+4.7=14.2) comparable with high-tax countries such as Finland, Austria or Belgium and even more than in France.
Although the VAT is an easily applied method of taxing general consumption, imposing a VAT on the federal and state level would seriously harm America's future growth, investment, personal consumption, manufacturing activity and productivity. It would make America look like a typical slow-growth European welfare state for the first time.
Friday, April 02, 2010
THE EUROPEAN BAY OF "PIIGS"
The Economist published a fascinating overview (link) of the macroeconomic indicators in Europe's most vulnerable economies in the current debt crisis (Portugal, Italy, Ireland, Greece, Spain).
Wednesday, March 24, 2010
UK ECONOMY UNDER LABOUR PARTY
Daily Telepgraph collected a few interesting graphs (link) depicting the UK economic performance and discussing the economic legacy of the Labour Party.
Tuesday, March 23, 2010
LESSONS FROM CHILE
Hernan Buchi, former minister of finance in Chile, recently published a new book The Economic Transformation of Chile (link) where he outlined comprehensive economic reforms that boosted economic growth, lowered unemployment, reduced poverty and set the stage for more than two decades of robust growth and an economic turnaround which has been unprecendent in Latin America.
The books serves the reader with a menu of intriguing facts, curious statistics and precise analysis of how macroeconomic stability was achieved. Chile has been the leading nation in Latin America with the most stable and predictable inflation rate. Country's decent fiscal management and solid macroeconomic outlook were important cornerstones behind the invitation to the OECD.
According to Jose Pinera (link), Chile is expected to enter the club of developed nations in 2018, the first Latin American country ever. Chile pioneered the privatization of the pension system in early 1980s. Today, country's fully-funded pension system based on individual savings accounts is a model for the rest of the world (link) in overhauling unfunded pay-as-you-go social security systems.
The books serves the reader with a menu of intriguing facts, curious statistics and precise analysis of how macroeconomic stability was achieved. Chile has been the leading nation in Latin America with the most stable and predictable inflation rate. Country's decent fiscal management and solid macroeconomic outlook were important cornerstones behind the invitation to the OECD.
According to Jose Pinera (link), Chile is expected to enter the club of developed nations in 2018, the first Latin American country ever. Chile pioneered the privatization of the pension system in early 1980s. Today, country's fully-funded pension system based on individual savings accounts is a model for the rest of the world (link) in overhauling unfunded pay-as-you-go social security systems.
Thursday, March 18, 2010
ICELAND'S ECONOMIC AND FINANCIAL CRISIS
I recently presented my recent paper on Iceland's economic and financial crisis (link) in the European Parliament in Brussels (link). Three days ago, the publication of the paper has also been approved by the SSRN (link).
Let me briefly touch the evolution of Icelandic crisis. The roots of the Icelandic financial crisis go back to late 1980s, when the Icelandic economy recovered from subsequent periods of high, volatile and unpredictable inflation. In 1983, the annual inflation rate reached as high as 100 percent. Throughout the 1980s, the economic policymakers were gradually abandoning the Keynesian doctrine. Until the oil shocks plunged the country into rampant inflation and fragile economic growth, it was widely believed that a little higher inflation is the price of low unemployment.
The period from late 1980s to early 1990s had been an important milestone for Iceland's macroeconomic recovery alongside the change in the political tide. The central bank was granted independence in inflation targeting, the government pursued a wide array of structural and economic reforms to boost the economic growth. Corporate tax rate had been reduced from a near 50 percent bracket, labor and product markets were liberalized and the financial sector was in the beginning of the privatization. The beginning of the 20th century was an unusually favorable period for Iceland's macroeconomic stability. Aside from one of the world's best institutions and governance, Iceland is perhaps the only developed country with favorable long-term demographics. The share of the population above the age thresold of 65 is only 11 percent. For instance, in Italy more than 20 percent of the population is in the age thresold of 65 and above. Iceland's favorable demographic outlook and a bold move towards defined-contribution pension system make the country the only developed nation with stable and fiscally solvent social security transition in the long-run. (total assets of pension funds as a share of GDP stood at 114 percent of the GDP in 2008 - more than any other OECD nation).
In 2001/2002, Iceland fell into a short-lived recession, mostly as a result of external imbalances and current-account adjustment to the global economic slowdown. In spite of the favorable macroeconomic outlook, Iceland's central bank failed in terms of the inflation targeting. From 1980 onwards, Iceland has had the most volatile inflation rate in the OECD, surpassing countries with unstable inflation such as Greece. Between 1980 and 2009, the average standard deviation of inflation was 20.45 percentage points, almost 20 times the deviation of inflation in countries with the least volatile inflation (Austria, Germany, Netherlands). Behind the unpredictable inflation rate was an unprecendent development of banking and financial industry. Iceland maintained high interest rate to contain inflationary pressures which were the main threat to macroeconomic stability since 1980s. Consequently, there was a large interest rate differential between Iceland and the rest of the world.
In a small and open economy such as Iceland high interest rate differential triggered "carry trading" against uncovered interst parity. Investors thus borrowed in Icelandic currency and invested in Icelandic stock and bonds in search of high short-term yields and then, after a certain period of time, swapped it into safer currencies. In the mean time, Icelandic currency (Krona) strongly appreciated and created an artificial wealth illusion which stimulated imports and further boosted economic growth towards an incredible 7 percent in 2007. The central bank raised the key interest rate further to contain potential inflationary pressure. Consequently, massive capital inflows strengthened krona's appreciation.
At the same time, the banking industry expanded abroad and enjoyed significant return on equity as a result of high interest margins on short-term loans in Krona-denominated loans. Icelandic banks were recognized as well-managed and, at the same time, enjoyed favorable ratings from Fitch, S&P and Moody. Three largest banks (Kaupthing, Glintir and Landsbanki) grew for more than 10 times the country's GDP. These banks easily expanded abroad as world interest rates converged towards zero. In such circumstances, banks offered loans in foreign currency and enjoyed strong interest margins from short-term loans in domestic currency. Icelandic households avoided loans in Icelandic currency given high interest rate but had significant foreign currency loan portfolio offered at very low rates. In a few years, loans in foreign currency exceeded domestic money supply by several times.
From 2004 onwards, Iceland's banking industry emerged as one of the most over-leveraged in the world. High leverage could be sustained as long as the global interbank marked was stable. When the subprime mortgage crisis spread across the U.S, there were early signs that Iceland will likely experience a significant contraction and current account deficit. For example, Danske Bank from Denmark warned in 2006 how disastrous could be the Icelandic crisis:
The global interbank market froze after the failure of Lehman Brothers when the crisis spread globally. At that time, CDS rates on Icelandic banks rose as investors demanded higher premia given the significant magnitude of financial risk. Bond spreads literally exploded. The three largest banks filed for bankruptcy. When the banks failed, gross external liabilites rose to more than 900 percent of country's GDP. Given spare fiscal and monetary capacity, the central bank failed to act as a lender of the last resort and the bailout such as Bear Stearns seemed implausible. The country fell into the deepest and most significant crisis ever experienced by a small country in a peace-time history. The recession, which lasted for more than year, was marred by turbulent inflation rate, stunning negative output gap and high unemployment rate.
The prospects for the Icelandic recovery were initially bleak due to unemployment surge, current account deficit and high public debt. In 2010, the recovery prospects seem more favorable with economic growth rate returning to 4 percent level by 2014. There's also been a lot of debate about Iceland's potential EMU membership - mostly in the light of Icesave deposit repayment to Dutch and British taxpayers. As I thoroughly discussed in the paper, Iceland is not an optimum currency area mostly because adjustment to common monetary policy would require a substantial exchange rate alignment which would inevitably result in inflationary wage pressure and seriously deteriorate country's macroeconomic stability in the long run.
Let me briefly touch the evolution of Icelandic crisis. The roots of the Icelandic financial crisis go back to late 1980s, when the Icelandic economy recovered from subsequent periods of high, volatile and unpredictable inflation. In 1983, the annual inflation rate reached as high as 100 percent. Throughout the 1980s, the economic policymakers were gradually abandoning the Keynesian doctrine. Until the oil shocks plunged the country into rampant inflation and fragile economic growth, it was widely believed that a little higher inflation is the price of low unemployment.
The period from late 1980s to early 1990s had been an important milestone for Iceland's macroeconomic recovery alongside the change in the political tide. The central bank was granted independence in inflation targeting, the government pursued a wide array of structural and economic reforms to boost the economic growth. Corporate tax rate had been reduced from a near 50 percent bracket, labor and product markets were liberalized and the financial sector was in the beginning of the privatization. The beginning of the 20th century was an unusually favorable period for Iceland's macroeconomic stability. Aside from one of the world's best institutions and governance, Iceland is perhaps the only developed country with favorable long-term demographics. The share of the population above the age thresold of 65 is only 11 percent. For instance, in Italy more than 20 percent of the population is in the age thresold of 65 and above. Iceland's favorable demographic outlook and a bold move towards defined-contribution pension system make the country the only developed nation with stable and fiscally solvent social security transition in the long-run. (total assets of pension funds as a share of GDP stood at 114 percent of the GDP in 2008 - more than any other OECD nation).
In 2001/2002, Iceland fell into a short-lived recession, mostly as a result of external imbalances and current-account adjustment to the global economic slowdown. In spite of the favorable macroeconomic outlook, Iceland's central bank failed in terms of the inflation targeting. From 1980 onwards, Iceland has had the most volatile inflation rate in the OECD, surpassing countries with unstable inflation such as Greece. Between 1980 and 2009, the average standard deviation of inflation was 20.45 percentage points, almost 20 times the deviation of inflation in countries with the least volatile inflation (Austria, Germany, Netherlands). Behind the unpredictable inflation rate was an unprecendent development of banking and financial industry. Iceland maintained high interest rate to contain inflationary pressures which were the main threat to macroeconomic stability since 1980s. Consequently, there was a large interest rate differential between Iceland and the rest of the world.
In a small and open economy such as Iceland high interest rate differential triggered "carry trading" against uncovered interst parity. Investors thus borrowed in Icelandic currency and invested in Icelandic stock and bonds in search of high short-term yields and then, after a certain period of time, swapped it into safer currencies. In the mean time, Icelandic currency (Krona) strongly appreciated and created an artificial wealth illusion which stimulated imports and further boosted economic growth towards an incredible 7 percent in 2007. The central bank raised the key interest rate further to contain potential inflationary pressure. Consequently, massive capital inflows strengthened krona's appreciation.
At the same time, the banking industry expanded abroad and enjoyed significant return on equity as a result of high interest margins on short-term loans in Krona-denominated loans. Icelandic banks were recognized as well-managed and, at the same time, enjoyed favorable ratings from Fitch, S&P and Moody. Three largest banks (Kaupthing, Glintir and Landsbanki) grew for more than 10 times the country's GDP. These banks easily expanded abroad as world interest rates converged towards zero. In such circumstances, banks offered loans in foreign currency and enjoyed strong interest margins from short-term loans in domestic currency. Icelandic households avoided loans in Icelandic currency given high interest rate but had significant foreign currency loan portfolio offered at very low rates. In a few years, loans in foreign currency exceeded domestic money supply by several times.
From 2004 onwards, Iceland's banking industry emerged as one of the most over-leveraged in the world. High leverage could be sustained as long as the global interbank marked was stable. When the subprime mortgage crisis spread across the U.S, there were early signs that Iceland will likely experience a significant contraction and current account deficit. For example, Danske Bank from Denmark warned in 2006 how disastrous could be the Icelandic crisis:
“On most measures, the small Icelandic economy is one of the most overheated in the OECD. Unemployment stands at 1 percent, wage growth is above 7 percent, and inflation is running above 4 percent despite a strong ISK. The current account deficit is closing in on 20 percent of the GDP. The Icelandic central bank has been hiking rates substantially in order to cool the economy and rates are now above 10 percent. Based on the macro data alone, we think that the economy is heading for a recession in 2006-07. GDP could probably dip 5-10 percent in the next two years and inflation is likely to spike above 10 percent as the ISK depreciates markedly. However, on top of the macro boom, there has been a stunning expansion of debt, leverage and risk-taking that is almost without precedence anywhere in the world. External debt is now at 300 percent of the GDP while short-term external debt is just short of 55 percent of the GDP. This is 133 percent of Icelandic export revenues.”
The global interbank market froze after the failure of Lehman Brothers when the crisis spread globally. At that time, CDS rates on Icelandic banks rose as investors demanded higher premia given the significant magnitude of financial risk. Bond spreads literally exploded. The three largest banks filed for bankruptcy. When the banks failed, gross external liabilites rose to more than 900 percent of country's GDP. Given spare fiscal and monetary capacity, the central bank failed to act as a lender of the last resort and the bailout such as Bear Stearns seemed implausible. The country fell into the deepest and most significant crisis ever experienced by a small country in a peace-time history. The recession, which lasted for more than year, was marred by turbulent inflation rate, stunning negative output gap and high unemployment rate.
The prospects for the Icelandic recovery were initially bleak due to unemployment surge, current account deficit and high public debt. In 2010, the recovery prospects seem more favorable with economic growth rate returning to 4 percent level by 2014. There's also been a lot of debate about Iceland's potential EMU membership - mostly in the light of Icesave deposit repayment to Dutch and British taxpayers. As I thoroughly discussed in the paper, Iceland is not an optimum currency area mostly because adjustment to common monetary policy would require a substantial exchange rate alignment which would inevitably result in inflationary wage pressure and seriously deteriorate country's macroeconomic stability in the long run.
Tuesday, March 16, 2010
CHINA'S EXCHANGE RATE POLICY
Saturday, March 13, 2010
READINGS FOR THIS WEEK
Here's a list of interesting readings for this week.
Gary Becker (link) and Richard Posner (link) briefly discuss the economic effects of fiscal stimulus and review the main literature on fiscal multiplier and the macroeconomic cost of the stimulus bill.
Congressional Budget Office published Budget Outlook 2010 (link) in which it analyzed the total effects of policy alternatives on federal budget deficit.
In NY Times, Paul Krugman discussed (link) the painfulness of financial crisis in Ireland and the U.S and suggesting what we should learn from banking regulation in Canada to prevent future crises of similar proportions.
In How to close the productivity gap between the US and Europe: A quantitative assessment using a semi-endogenous growth model, Werner Roeger, Janos Varga and Jan in 't Veld from the European Commission suggest (link) that to catch-up the US productivity level, the EU should strengthen market competition and eliminate administrative and financial barriers to market entry to start closing the gap in knowledge investment.
In Waging War on Black Teens, Richard W. Rahn and Izzy Santa wrote (link) about the high unemployment rate among young African Americans. Furthermore, they suggest that minimum wage mandate is the main cause of steep unemployment rise thereupon.
The Economist (link) summarized the estimated total cost of reconstruction after the earthquake in Chile at $20-30 billion (13-19 percent of the GDP). Chile's sovereign wealth fund has just over $11 billion saved during the pre-crisis period of high copper prices which, at that time, stood at record levels.
Gary Becker (link) and Richard Posner (link) briefly discuss the economic effects of fiscal stimulus and review the main literature on fiscal multiplier and the macroeconomic cost of the stimulus bill.
Congressional Budget Office published Budget Outlook 2010 (link) in which it analyzed the total effects of policy alternatives on federal budget deficit.
In NY Times, Paul Krugman discussed (link) the painfulness of financial crisis in Ireland and the U.S and suggesting what we should learn from banking regulation in Canada to prevent future crises of similar proportions.
In How to close the productivity gap between the US and Europe: A quantitative assessment using a semi-endogenous growth model, Werner Roeger, Janos Varga and Jan in 't Veld from the European Commission suggest (link) that to catch-up the US productivity level, the EU should strengthen market competition and eliminate administrative and financial barriers to market entry to start closing the gap in knowledge investment.
In Waging War on Black Teens, Richard W. Rahn and Izzy Santa wrote (link) about the high unemployment rate among young African Americans. Furthermore, they suggest that minimum wage mandate is the main cause of steep unemployment rise thereupon.
The Economist (link) summarized the estimated total cost of reconstruction after the earthquake in Chile at $20-30 billion (13-19 percent of the GDP). Chile's sovereign wealth fund has just over $11 billion saved during the pre-crisis period of high copper prices which, at that time, stood at record levels.
Thursday, March 04, 2010
HOW MILTON FRIEDMAN SAVED CHILE?
Here (link) is the story of how decades of economic freedom prevent the unthinkable consequences of an earthquake which recently damaged Chile.
Wednesday, February 24, 2010

Wednesday, February 17, 2010
WILL FISCAL ASYMMETRIES THREATEN THE EURO?
Earlier this day, I came across Moody's Misery Index (link) which estimated the size of macroeconomic difficulties in European countries. In particular, European countries within and outside the Eurozone are likely to face stagnant GDP growth rates, high unemployment rates, deflationary pressures and a depressing fiscal outlook.
Debt-to-GDP ratio in selected countries
 Source: Market Oracle (link)
Spain topped the Moody's Misery Index due to the highest estimated unemployment rate for 2010 and a whopping fiscal deficit. Where's the trouble? As I wrote earlier (link), prior to the outbreak of financial crisis, Spain had a favorable fiscal outlook in 2006 and 2007 and an unfavorable current account balance . In 2007, Spain experienced a 10 percent of the GDP current account deficit largely due to net capital inflows from surplus countries such as Germany and Netherands. These net capital inflows further inflated asset prices, causing an outburst of asset bubble. In the mean time, asset price inflation escalated and real estate price index soared. Government's remaining choice was to push for a fiscal surplus to avoid the inflationary shocks. When the bubble turned into burst, the shortage of external demand (in spite of favorable domestic consumption rate) caused the economy's overcapacity and a deeply negative output gap. In 2008, Spain's economy overheated and the output gap increased to historic highs (3.06 percent of potential GDP). In 2010, the estimated output gap is -2.12 percent of potential GDP. Due to weak aggregate demand - especially weak investment and external demand - asset and consumer prices are decreasing. As firms are reluctant to hire new labor, the result is high rate of unemployment, deflationary pressure and non-existent GDP growth. The macroeconomic situation in Spain pretty much reflects the general macro outlook for the entire Eurozone.
If the ECB decided to raise interest rates significantly, it would further depress an already weak investment activity. If ECB's interest rates decreased further, there would be a serious danger of deflationary trap which dragged the Japanese economy into a decade long period of deflation rates, zero-bound interest rates and stagnant economic recovery. As European population is aging rapidly (as in Japan and other industrialized nations), the outlook for the European economic recovery is rather timid.
Rapidly rising fiscal deficit (link) and public debt is a permanent threat to the stability of the Euro. Of course, the best possible cure to decrease the debt-to-GDP ratio is higher economic growth and also higher rate of inflation which decreases the stock of public debt through higher price level. Europe's real macroeconomic disease is not just low productivity growth and high tax burden but also very asymmetric economic policies. While the ECB sets interest rates for the entire Eurozone, Euroarea countries set independent fiscal policies. In addition, the appreciation of the euro hinders currency swaps into high-yield currencies. That could enable covered interest parity and the reinvestment of foreign currency back into Euro when its appreciation trend would reverse.
Asymmetric fiscal policies are likely to cause significant public debt concern if fiscal policies are discretionary. Prior to the emergence of economic crisis, half of the European countries ran discretionary deficit-financed fiscal policies. If European countries ran prudent fiscal policy based on low government spending and balanced budget, the asymmetric fiscal shocks weren't a major problem at all. However, strong public sector, high government spending and the lack of rule-based fiscal policies pose a significant concern for the stability of the Euro.
What I propose, is not the harmonization of fiscal policy but a strong committment of European countries to limit the scope of discretion in fiscal policy. Each country should forge a prudent fiscal policy without high fiscal deficit. In addition, countries should set a medium-term perspective of public debt reduction. That would ease the problem of asymmetric shocks during economic downturns and enhance the prospects of European single currency. In addition, European countries should rigorously liberalize labor markets. The liberalization of the labor market would remove the unneccesary wage adjustment rigidities. When wages are rigid downward - especially during the recession - higher wages exacerbate a significant pressure on unemployment. And when unemployment rate is high, the demand for discretionary fiscal policy and deficit spending is very high as well.
Without the necessary liberalization of labor market and the pursuit of prudent fiscal policies, the future of Euro and the prospects of the Eurozone are not bright at all.
Moody's Sovereign Misery Index

Debt-to-GDP ratio in selected countries
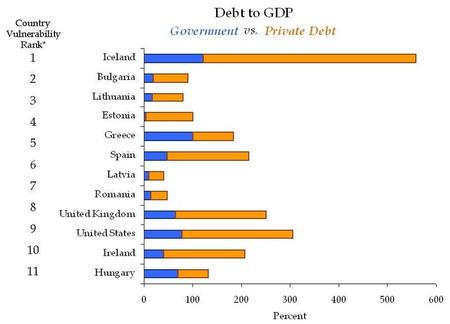 Source: Market Oracle (link)
Spain topped the Moody's Misery Index due to the highest estimated unemployment rate for 2010 and a whopping fiscal deficit. Where's the trouble? As I wrote earlier (link), prior to the outbreak of financial crisis, Spain had a favorable fiscal outlook in 2006 and 2007 and an unfavorable current account balance . In 2007, Spain experienced a 10 percent of the GDP current account deficit largely due to net capital inflows from surplus countries such as Germany and Netherands. These net capital inflows further inflated asset prices, causing an outburst of asset bubble. In the mean time, asset price inflation escalated and real estate price index soared. Government's remaining choice was to push for a fiscal surplus to avoid the inflationary shocks. When the bubble turned into burst, the shortage of external demand (in spite of favorable domestic consumption rate) caused the economy's overcapacity and a deeply negative output gap. In 2008, Spain's economy overheated and the output gap increased to historic highs (3.06 percent of potential GDP). In 2010, the estimated output gap is -2.12 percent of potential GDP. Due to weak aggregate demand - especially weak investment and external demand - asset and consumer prices are decreasing. As firms are reluctant to hire new labor, the result is high rate of unemployment, deflationary pressure and non-existent GDP growth. The macroeconomic situation in Spain pretty much reflects the general macro outlook for the entire Eurozone.
If the ECB decided to raise interest rates significantly, it would further depress an already weak investment activity. If ECB's interest rates decreased further, there would be a serious danger of deflationary trap which dragged the Japanese economy into a decade long period of deflation rates, zero-bound interest rates and stagnant economic recovery. As European population is aging rapidly (as in Japan and other industrialized nations), the outlook for the European economic recovery is rather timid.
Rapidly rising fiscal deficit (link) and public debt is a permanent threat to the stability of the Euro. Of course, the best possible cure to decrease the debt-to-GDP ratio is higher economic growth and also higher rate of inflation which decreases the stock of public debt through higher price level. Europe's real macroeconomic disease is not just low productivity growth and high tax burden but also very asymmetric economic policies. While the ECB sets interest rates for the entire Eurozone, Euroarea countries set independent fiscal policies. In addition, the appreciation of the euro hinders currency swaps into high-yield currencies. That could enable covered interest parity and the reinvestment of foreign currency back into Euro when its appreciation trend would reverse.
Asymmetric fiscal policies are likely to cause significant public debt concern if fiscal policies are discretionary. Prior to the emergence of economic crisis, half of the European countries ran discretionary deficit-financed fiscal policies. If European countries ran prudent fiscal policy based on low government spending and balanced budget, the asymmetric fiscal shocks weren't a major problem at all. However, strong public sector, high government spending and the lack of rule-based fiscal policies pose a significant concern for the stability of the Euro.
What I propose, is not the harmonization of fiscal policy but a strong committment of European countries to limit the scope of discretion in fiscal policy. Each country should forge a prudent fiscal policy without high fiscal deficit. In addition, countries should set a medium-term perspective of public debt reduction. That would ease the problem of asymmetric shocks during economic downturns and enhance the prospects of European single currency. In addition, European countries should rigorously liberalize labor markets. The liberalization of the labor market would remove the unneccesary wage adjustment rigidities. When wages are rigid downward - especially during the recession - higher wages exacerbate a significant pressure on unemployment. And when unemployment rate is high, the demand for discretionary fiscal policy and deficit spending is very high as well.
Without the necessary liberalization of labor market and the pursuit of prudent fiscal policies, the future of Euro and the prospects of the Eurozone are not bright at all.
Saturday, February 13, 2010


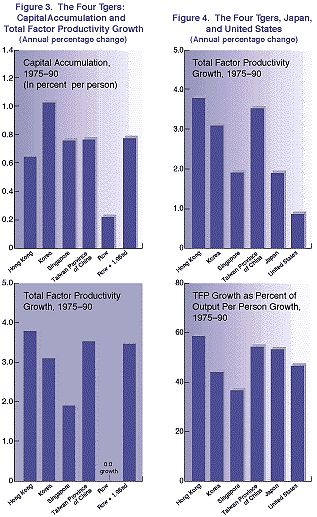

Friday, February 12, 2010
THE ORIGINS OF GREECE'S DEBT CRISIS
Paul De Grauwe published a very good article (link), discussing the macroeconomic origins of the current debt crisis in Greece.
"The period 1999-2009 has been organised in periods of booms and busts: the boom years were 1999-2001 and 2005-07; the bust years were 2002-04 and 2008-09.
One observes a number of remarkable patterns.
- First, private debt increases much more than public debt throughout the whole period (compare the left hand axis with the right hand axis).
- Second, during boom years private debt increases spectacularly.
The latest boom period of 2005-07 stands out with yearly additions to private debt amounting on average to 35 percentage points of GDP.
- During these boom periods, public debt growth drops to 1 to 2 percentage points of GDP. The opposite occurs during bust years. Private debt growth slows down and public debt growth accelerates."
EUROPE'S BLEAK MACROECONOMIC OUTLOOK
The Economist published a very lucid analysis (link) of the recent macroeconomic instability in the Euroarea, following the outbreak of Greek debt crisis (link) and disappointing quarterly data on GDP growth (link):
Barely had the ink dried on a statement by European leaders supporting Greece in its struggle to finance its debts when more bad news emerged from the euro zone. Figures released on Friday February 12th showed that GDP in the 16-country currency zone rose by just 0.1% in the three months to the end of December compared with the previous quarter. That there was any improvement at all was largely down to France, where a burst of consumer spending lifted the economy by 0.6%. In the region’s other big countries, GDP was either flat—as in Germany—or falling, as in Italy and Spain.
Barely had the ink dried on a statement by European leaders supporting Greece in its struggle to finance its debts when more bad news emerged from the euro zone. Figures released on Friday February 12th showed that GDP in the 16-country currency zone rose by just 0.1% in the three months to the end of December compared with the previous quarter. That there was any improvement at all was largely down to France, where a burst of consumer spending lifted the economy by 0.6%. In the region’s other big countries, GDP was either flat—as in Germany—or falling, as in Italy and Spain.
Subscribe to:
Posts (Atom)