Wednesday, September 15, 2010

OPEC AND THE LOGIC OF CARTELS

Recently, the Organization of Petroleum Exporting Countries (OPEC) celebrated its 50th anniversary (link). The organization was founded in 1960 with the purpose of regulating world's oil prices and controlling the supplies of oil. Currently, OPEC controls 80 percent of world's proven oil reserves and its 12 member states oil production capacity accounts for 40 percent of world's total oil production.


OPEC's oil production and the world economy
Source: The Economist (link)

As a profit-maximizing monopolist, OPEC is faced with a downward sloping demand curve and upward sloping marginal cost curve which represents the market supply curve of the orgaization's 12 member states. As a profit-maximizing agent, OPEC countries equate marginal cost of production and marginal revenue from oil supplies and thus extract the entire consumer surplus from oil importing countries such as the United States, Japan and the European Union. There are several plausible explanation of OPEC's monopoly power in the world oil market. First, oil is a good with no close substitutes. Thus, the price elasticity of oil demand curve is significantly price inelastic. The average empirical estimate of the world price elasticity of demand for oil is -0.4, suggesting that a 10 percent increase in the price of oil would, on average, reduce the market demand for oil by 4 percent, ceteris paribus.

The relationship between the total revenue of the monopolist and the elasticity of demand suggests that the unit elasticity of demand is the revenue-maximizing point elasticity of demand for the monopoly firm such as OPEC. As the graph shows, OPEC's price spikes occured mostly during external shocks such as the 1973 oil shocks, Arab-Israeli war and the recent financial crisis. The spikes in the world price of oil reflected the pure logic of OPEC's cartel. By pushing the price upward, OPEC countries realized that, in the short run, the price elasticity of demand for oil is even more inelastic, thus reducing the consumer surplus of oil importing countries while expanding the producer surplus of OPEC member states.

The strategic behavior of OPEC mostly depends on the nature of external shocks affecting the production capacity and reserves of world's oil supplies. During political conflicts, the short-run demand for oil spiked and, therefore, the price elasticity of demand for oil decreased, increasing OPEC's short run producer surplus. Thereupon, OPEC member states set oil production quotas which exactly reflected the organization's intention to extract the entire consumer surplus from oil importing countries. Also, during the pre-2008 economic boom, the economic growth in emerging markets further inflated the world price of oil since the OPEC's short run production capacity outpaced the quotas set by the organization. But during the recent financial crisis, the short-run response of OPEC has been the reduction of per barrel oil price as an strategic step towards maintain the stability of market demand for oil. During the recent crisis, personal consumption and incomes have fallen substantially and therefore, assuming the positive income elasticity of demand for oil, the world demand for oil decreased considerably. The change in the aggregate consumption of oil has led to relatively more price elastic demand for oil. Partly, the increase in the price elasticity of oil is explained by the technological innovation and market access to long-run substitutes of oil such as fuel-efficient and electric vehicles and electric cars.

The technological development of fuel-efficient vehicles has decreased the monopoly power of OPEC by increasing the price elasticity of demand for oil due to the availibility of closer substitutes. In the follow-up of the financial crisis, the OPEC set the per barrel price of oil at $75. Given the downward sloping market demand curve, the short-run oil consumption increased and OPEC thus raised the relative price of oil's substitutes since it acknowledged the switching costs of changing the consumption of durable goods which complement the consumption of oil. What OPEC did is that it attempted to establish the short-run price elasticity of oil close to unity and, thereby, effectively increase the total revenue of the organization's member states. However, if in the long run, the market demand for oil was elastic, the net effect of increasing the price of oil, would incidentally fall on the burden of OPEC producers. Therefore, relatively price inelastic demand and price elastic oil supply is the main source of OPEC's monopoly power in the world oil market.

The rationale behind the cartelled market organization of oil supply is the stability of demand for oil across the world. Could OPEC's monopoly power, in effect, be broken if one country would set asymmetric prices on the global oil market. The desire of OPEC member states to fully collude in the cartel is the well-known phenomena from industrial organization known as the trigger strategy. According to trigger strategy, a member of the cartel is likely to divert from the cartel's strategy only if long-term gains outpace short-term losses of acting in accordance with the cartel's strategic behavior. In purely theoretical terms, if Nash equlibrium exists in the long-term benefits of cooperation, the diversion from cartel's strategic behavior, will not be feasible.

Even though some OPEC member states face asymmetric market demand curves in the short run, the stability of world oil demand embodied in the relatively price inelastic oil demand decrease the feasibility of defection from the cartel's strategic targets, discounted benefits from the collusion far outpace potential short-term losses.

Friday, September 10, 2010

EARNINGS AND EDUCATION: A SURVEY

In 2009, the median weekly earnings of workers with bachelor's degrees were $1,137. This amount is 1.8 times the average amount earned by those with only a high school diploma, and 2.5 times the earnings of high school dropouts (link).

CHINA'S GROWTH MODEL

According to some preliminary estimates (link), China's trade balance is on the course for a significant surplus this year. IMF's annual forecast of current account balance predicted China's trade surplus at $334 billion in 2010 or roughly 6.2 percent of China's GDP. The IMF's medium-term forecast suggests a growing trade surplus by 2015 when the surplus is estimated at a little more than 8 percent of GDP.

Recently, Dani Rodrik questioned (link) the persistence of China's mercantilism based on persistently low exchange rate. The partial fixation of the exchange rate then stimulates export-led growth model and, consequently, results in a large trade surplus which translates into foreign exchange reserves, thus enabling China's central bank to foster exchange rate intervention to defended the targeted yuan exchange rate against the U.S dollar. The implications of China's growth model extend beyond the scope of effects on country's economic growth, investment and current account balance. China's export-led growth model has tremendously affected the macroeconomic performance of developing nations. The exports of developing nations in the European, Japanese and U.S markets basically substitute, not complement, China's exports to the markets of advanced countries. The persistent lack of the appreciation of renmimbi thus forced the economic policymakers of other developing nations to either adopt the same model of exchange rate intervention or lose the export share in developing countries. This intuition is underlined by the theoretical and empirical support.

In 2007, Hausmann, Hwang and Rodrik demonstated (link) that the pattern of specialization by developing countries predicts the subsequent economic growth, suggesting that the share of exports in advanced countries is highly positively correlated with the rates of economic growth. If China shifted the main source of economic growth from export-led model to domestic consumption, the renmimbi would have to appreciate considerably. Contrary to the assertion that China's exchange rate undervaluation hampers the economic growth, industrialization and development prospects of developing nations, the OECD recently stated that developing countries would be hurt significantly if the renmimbi exchange rate were allowed to appreciate. There is also an empirical support for the particular assertion. The OECD recently estimated (link) that, if China's output grew by 1 percentage point, the output of developing countries would decrease by 0.3 percentage point.

The empirics supports the argument I mentioned earlier - China's exchange rate misalignment inevitably hinders the growth prospects and industrialization of developing countries. The essential question in the course of economic development is what is the best model of growth for developing countries to boost industrialization and development frontiers.

One possibility is the so called surplus model. Historically, growth models of low-income countries were primarily based on exporting natural resources to the rest of the world. Countries such as oil-rich gulf states, Botswana and Argentina became wealthy. Such growth model heavily depends on export demand in other countries. The most notable failure of this growth model is that it doesn't encourage the diversification of economic activity. Thus, countries such as Libya have sustained relatively high levels of GDP but, at the same time, rather depressing domestic indicators. For instance, Libya's GDP per capita is at almost the same level as Chile's GDP per capita, but Libya's unemployment rate is 30 percent - almost three times the average unemployment rate in countries with the same level of GDP per capita. When foreign demand deteriorates, these countries experience the Dutch disease - an overheating economic activity and overvalued exchange rates that discourage investment, entrepreneurship and typically result in higher unemployment rates.

Industrialization and economic development mostly depend on domestic structural change based on the adopting the institutions of macroeconomic stabilization and the rule of law. China's exchange rate policy of renmimbi undervaluation is a failed temporary growth model that is set on the unsustainable course. Without shifting the major engine of growth from export-boosting exchange rate undervaluation to consumption-based growth, Chinese economy will no longer be able to sustain high productivity growth rates. Letting the renmimbi appreciate by free floating could significantly boost the potential for institutional change in China and other developing nations. Therefore, the systemic abuse of macroeconomic policy by exchange rate undervaluation would no longer be feasible and the costs of failed exchange rate regime for developing countries would diminish substantially.

Monday, September 06, 2010

PRODUCTIVITY GROWTH IN BRAZIL

Carlos Pereira of the Brookings Institution (link) has reviewed the dismal productivity growth and the consequent macroeconomic indicators in Brazil in the last decade.

"Although there are several expenditures in this category, the one that stands out high above all others is outlays for social security and pensions. Practically one-third of the federal budget is devoted to these expenditures, whereas expenditures in investments were less than 6 percent in 2003. Pensions in Brazil since the 1988 constitution have been notably generous, especially in the civil service. A new group of non-contributing rural pensions was added, contributing to systematic deficits. With about 11.7 percent of GDP, Brazil has one of the highest social security expenditures in the world, especially considering that the Brazilian population is much younger than that of most countries with similar levels of expenditure."

Sunday, September 05, 2010

SKILLED IMMIGRATION AND INNOVATION

A recent paper by Jennifer Hunt (link) finds that the increase in foreign-born graduates strongly contributes to the innovation in the United States:

"In this paper I have demonstrated the important boost to innovation per capita provided by skilled immigration to the United States in 1950-2000. A calculation of the effect of immigration in the 1990-2000 period puts the magnitudes of the effects in context.

The 1990-2000 increase from 2.2% to 3.5% in the share of the population composed of immigrant college graduates increased patenting by at least 81:3 = 10:4%, and perhaps by as much as 18%. The increase in the share of post-college immigrants from 0.9% to 1.6% increased patenting by at least 10.5% and perhaps by as much as 24%. The increase from 0.30% to 0.55% in the share of workers who are immigrant scientists and engineers increased patenting by at least 13% but probably by less than 23%.

While I find evidence for the crowding-out of natives in the short run, in the long run there is evidence for the reverse: that skilled natives are attracted to states or occupations with skilled immigrants. The results hint that skilled immigrants innovate more than their native counterparts, especially if they are scientists or engineers. If correct, the result could reflect higher education of immigrants within skill categories, or positive selection of immigrants in terms of ability to innovate. However, the effect of natives is not as well identified econometrically as the effect of immigrants."

Thanks to New Economist (link) for the pointer!

WHY DO THE POOR CHOOSE TO LIVE IN CITIES?

In the recent edition of Yale Economic Review (link), Ed Glaeser, Matthew Kahn and Jordan Rappaport ponder one of the most difficult and challenging puzzles of urban economics:

"The 2000 U.S. Census shows that the average poverty rate in American cities drops significantly, from about 20% to 7.5%, as you move from the CBD of a city to its suburbs. How can we tell that this connection between city residence and poverty comes from treatment – that is, cities make people poor – rather than from selection, where the poor disproportionately move to central cities? Here, the data support selection: although ghettos may exacerbate poverty, poor people move disproportionately to the center of the cit- ies, either when switching homes or moving to a new metropolitan area... Given the high proportion of the urban poor who are Black, one might think that inner-city poverty is really just another example of the segregation of minorities. However, [the authors] found that poor Whites have roughly the same central city - suburb poverty gap as Blacks, so it is unlikely that race plays an important role in the centralization of the poor."

AFRICAN SUCCESS STORY: BOTSWANA

An intriguing empirical finding from the institutional perspective of economic development from Daron Acemoglu, Simon Johnson and James A. Robinson (link):

"Botswana has had the highest rate of per capita growth of any country in the world in the last 35 years. This occurred despite adverse initial conditions, including minimal investment during the colonial period and high inequality. Botswana achieved this rapid development by following orthodox economic policies. How Botswana sustained these policies is a puzzle because typically in Africa, ‘good economics’ has proved not to be politically feasible. In this Paper we suggest that good policies were chosen in Botswana because good institutions, which we refer to as institutions of private property, were in place...

Why did institutions of private property arise in Botswana, but not other African nations? We conjecture that the following factors were important. First, Botswana possessed relatively inclusive pre-colonial institutions, placing constraints on political elites. Second, the effect of British colonialism on Botswana was minimal, and did not destroy these institutions. Third, following independence, maintaining and strengthening institutions of private property were in the economic interests of the elite. Fourth, Botswana is very rich in diamonds, which created enough rents that no group wanted to challenge the status quo at the expense of ‘rocking the boat’. Finally, we emphasize that this situation was reinforced by a number of critical decisions made by the post-independence leaders, particularly Presidents Khama and Masire.
"

Friday, September 03, 2010

AUTHORITARIAN POLITICS AND ECONOMIC GROWTH

Dani Rodrik argues (link) that political dictatorship is damaging to economic growth since democracies not only outperformed countries with flawed political regimes in the dynamics of economic growth but also in terms of greater civil, economic and political liberties and investment in education that help enforce better public policies and yield better prospects of economic development.

"Democracies not only out-perform dictatorships when it comes to long-term economic growth, but also outdo them in several other important respects. They provide much greater economic stability, measured by the ups and downs of the business cycle. They are better at adjusting to external economic shocks (such as terms-of-trade declines or sudden stops in capital inflows). They generate more investment in human capital – health and education. And they produce more equitable societies."

THE 2015 SOVEREIGN DEBT FORECAST


Source: The Economist, Sovereign Debt: Wiggle Room, September 2, 2010 (link)

Thursday, July 15, 2010

POVERTY, INCOME INEQUALITY AND ECONOMIC DEVELOPMENT

Financial Times reports (link) on the new measure of poverty proposed by economists from Oxford University. The authors suggested the modification of current measure of poverty which, defined by the World Bank in annually published World Development Report, is currently set at the thresold of $1.25 per day or less. The new measure proposed by economic researchers from Oxford University sets the definition of poverty in a more sophisticated framework based on the household availibility of access to clean water, education, health care and other durable and non-durable goods. The new method, called Alkire-Foster approach, incorporates the qualitative elements into the measurement of poverty.

Using the new method, the authors examined poverty rates in four Indian provinces and evaluated the approach in comparison to the existing income method which had been used in economic and policy analysis by the World Bank and other institutions of economic development. The authors found a significant divergence of poverty rates when measured in both methods. For instance, under Alkire-Foster approach, the poverty rate in Indian state Jharkhand is 50 percent higher compared to the rate of poverty measured under the income method. On the other hand, the authors of the new poverty measure have shown that in some Indian provinces such as Uttaranchal (link), the official measure of poverty highly over-estimates the effective poverty measure as defined by Oxford's Poverty and Human Development Initiative. The multidimensional worldwide poverty index is also availible on the web (link).

The intuitive question arising from the data and empirical research on poverty is whether higher economic growth in less developed countries boosts the growth of income per capita and what is the role of institutional characteristics in economic development. The authors of the abovementioned measure of poverty have shown that despite abundant economic growth in past years and falling income poverty rates, the share of population without access to clean water, sanitation and minimum required nutrition remained unchanged. The percentage of malnourished children in India decreased from 47 percent in 1998-98 to 46 percent 2005-06.

The theoretical and empirical literature on economic growth suggests that there is an inverse U-relationship between inequality and income per capita known as Kuznets curve (link). The intuition behind the relationship is simple. At the very low levels of income per capita, income inequality is low. Alongside the course of growing income per capita, income inequality steeply increases and, after reaching a maximum, it decreases as countries achieve higher levels of income per capita. The rate of income inequality is closely related to the evolution of economic policies over time. Wagner's law, discussed in one of the previous posts, states that government spending over time increases due to long-run income elastic demand for public goods and capture of the democratic system by the particular interest groups that pose a permanent pressure on the growth of government spending and resist the reversals of government expenditures by trading votes.

There's a wide array of disagreement among economists on the effect of income inequality on economic growth. Back in 2001, Joseph Stiglitz re-examined the East Asian economic miracle and concluded that the evidence from the period of high economic growth in East Asian countries suggests that income redistribution has a positive effect on economic growth (link). Stiglitz's argument is based on the income distribution in East Asian countries during the economic miracle. East Asian countries have been known for relatively even distribution of income demonstrated by high Gini index and relatively high income tax rates.

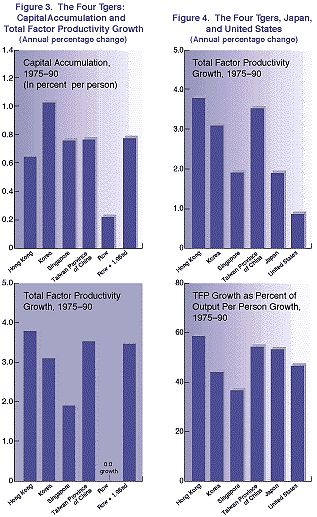
On the other hand, the empirical investigation of the initial conditions in East Asian countries before the economic miracle shows that the political influence of interest groups had been relatively weak compared to Western Europe after the World War 2 when the productivity growth stalled from early 1970s onwards. The relative weakness of interest groups and a stable judicial system, inherited from English common law tradition, enabled high economic growth in the longer run given an enduring stability of property rights protection and the rule of law. In such conditions, income redistribution had relatively little effect on economic growth since the empirics of East Asian miracle suggests that the sizeable proportion of growth in East Asian countries (Malaysia, Singapore, Korea and Taiwan) had been driven by technological progress, investment and export orientation. Considering export orientation, Rodrik et. al (2005) provided the evidence (link) on the positive effect of high-quality export orientation on economic growth. The productivity growth in East Asian countries between 1975 and 1990 had been a pure example of economic miracle defined by the share of growth that could not be explained by the contribution of labor and capital input. In Taiwan and Hong Kong (link), total factor productivity accounted for about 60 percent of output per capita growth. Between 1975 and 1990, in Singapore, output per capita had increased by 8.0 percent. Consequently, the resulting outcome of almost two decades of robust productivity growth had been a significant decrease in national poverty rates (link). The lowest poverty rate, as defined by the measures of home authorities, is in Taiwan where 0.95 of the population live below the poverty thresold.

The basic set of policies that alleviate extreme poverty such as providing access to clean water, nutrition, medical protection against HIV/AIDS and basic sanitary standards have a positive effect on the economic growth and the standard of living. However, the major cause of persistent under-development in Subsaharan and Tropical Africa is mostly the lack of institutional enforcement of property rights, the rule of law and independent judiciary. In spite of billions of USD of direct foreign aid, countries such as Zambia, Sierra Leone, Mali and Rwanda endure in persistent poverty and under-development. Esther Duflo, this year's recepient of John Bates Clark Award, has shown in several studies how field experiments can enlighten the understanding of incentives in least developed countries (link). Understanding the significance of incentives in reducing poverty is crucial to further examination of the relationship betwen income inequality and economic growth.

Wednesday, June 16, 2010

THE EMPIRICAL EVIDENCE ON WAGNER'S LAW

Ever since the original proposition by a 19th century German economist Adolph Wagner, Wagner's law has undergone significant theoretical and empirical discussion on its long-run validity. In the most basic and rudimentary version, the law states that alongside the economic development of industrial societies, there is a persistent tendency of an increasing share of government spending in the GDP. Since the beginning of the 20th century course, the growth in government expenditures has escalated in all major industrial countries. The economic literature has centered the discussion on two elementary versions of Wagner's law. The first version of Wagner's law attributes the growing share of government spending to the ever expanding power of interest groups.

The concept of interest groups has been thoroughly developed by a rigorous theoretical analysis by Mancur Olson's The Logic of Collective Action. There is a remarkably positive correlation between the growth of government spending and the political power of interest groups. Back in 1954, Milton Friedman and Simon Kuznets have analyzed the income dynamics in independent professions (link). Although there has not been much discussion in the economic literature, the Friedman-Kuznets analysis is an important milestone in the explanation of the evolution of interest groups. Friedman and Kuznets examined five independent professions. Using a comprehensive statistical analysis, they showed how income growth in five profession has exerted an upward trend without significant gains in productivity. The five independent professions analyzed by Friedman and Kuznets emerged as pure interest groups. These groups have imposed a regulated labor market structure marred by occupational licencing and aimed at gaining an insider's earnings rent at the expense of entry restriction. Occupational licensing is one of the most powerful explanatory features of low coefficient of price and income elasticity of labor supply of physicians, dentists, legal consultants and medical practitioners. In most of the industrial countries, these groups have emerged as powerful interest groups and triggered an unbreakable increase on the growth of government spending. The evolution of interest groups in fields such as agriculture, social security and trade has resulted in the intensive pressure on the growth of government spending. The interest group perspective on Wagner's law emphasizes the state capture created by the democratic system and an irreversible pattern of increases in government spending centered on small and powerful interest groups. If interest group's representative utility function can be described as a relationship between the group's size and its price elasticity of labor supply: U(f,e)=f(1-|e|), then the effect of a unit change in price elasticity of labor supply dU/de=-f indicates that greater price elasticity of labor supply will reduce the size (f) of the interest group as a result of pure substitution effect at work. On the other hand, if price elasticity of labor supply of the particular interest group will decrease, causing more price inelastic labor supply, the size of the interest group will increase since most of the excess wage increases will spill into physician's pocket.

The second version of Wagner's law states that an increase in government spending in time is a result of a high income elasticity of demand for public goods. Rati Ram (1986) has tested this hypothesis on the sample of 115 countries between 1950 and 1980. His conclusions suggest that income elasticity of demand for public goods is very elastice (exceeding 1) in 60 percent of all countries in the sample. A comprehensive development of econometric methodology has enabled a more rigorous and empirical evaluation of Wagner's law on the basis of long-run simulation using time-series data. For example Sidelis (2006) has applied cointegration analysis and Granger casuality tests to determine whether long-run changes in income account for the growth of government spending in Greece between 1833 and 1938 (link). The author concludes that income elastic demand for public goods caused a growth in government expenditures. A recent study by Lamartina and Zaghini (2008) indicates (link) a negative relationship between government spending and economic growth in a sample of 23 OECD countries. The study further suggests that the correlation between income growth and government expenditure is stronger in countries with low initial levels of GDP per capita. Neck and Getzner (2007) collected data on government expenditure in Austria between 1870 and 2002 and examined whether the surge of government expenditure is attributed to either Wagner's law or Baumol's cost disease. The authors applied Phillipe-Perron and Augmented Dickey-Fuller stationarity tests, concluding that government spending time series more likely represents a stationary time series. In concluding remarks, the authors note that much of the increase in government expenditure is a problem of increasing prices in public sector, relating the growth in public expenditures to Baumol's cost disease where output reduction in public sector is a result of net decrease in productivity growth which yields a significant pressure from public sector interest groups on expenditure increases.

Wagner's law is an intriguing theoretical and empirical issue. In spite of the numerous empirical evaluation and theoretical design, the issue will probably remain an intensive course of the academic debate.

Tuesday, June 08, 2010

THE ECONOMIC EFFECTS OF SODA TAX

Greg Mankiw (link) and David Leonhardt (link) have opened a debate on whether govenrment policymakers should levy a tax on soda and other soft drinks as an attempt to reverse the growing trend of obesity among the U.S. population. The idea of taxing soda has become popular as governments around the world have recorded high budget deficits and revenue shortfall. The real question is what would be the effects of taxing soda and, if so, would the introduction of the tax contribute to the reversal of the obesity pattern, especially among the child population.

There is a decent amount of empirical studies and health policy analyses on the patterns and causes of obesity. Obesity and the risk of premature death resulted from high blood pressure and the potential heart attack is the most individual cost of fast-food consumption. For a long period of time, we assumed that these costs at the individual level could be internalizied and, thus, raise no cost to the society. In the article published in Sunday's edition of NY Times Greg Mankiw drew parallels between soda and tobacco tax. If individuals consume a lot of cigarettes at home, there is, presumably, no negative externality shifted onto the society. The logic could be applied to soda taxation. However, there is a flip side to the argument. Taxing soda, tobacco and other goods with a negative impact on bystanders is an answer to the growing cost of health care delivery to the individuals who consume these goods. The adverse impact levied on other individuals is seen through higher health insurance premiums and total cost of health care.

John Cawley published an extensive analysis of the causes of early childhood obesity (link), suggesting greater government intervention and various cost-effectiveness measures to mitigate the adverse impact of childhood obesity on other members of the society. A study by Jason M. Fletcher, Daniel Frisvold and Nathan Tefft (link) has been one of the first attempts to measure the effect of vending machines restriction on childhood obesity. The authors concluded by suggesting higher tax rates and soft drink access restrictions in schools to fight the on-going increase in childhood obesity.

As Kelly Brownell of Yale Rudd Center for Food Policy and Obesity mentioned, the link between sugary drinks and obesity is stronger than the link between obesity and any other kind of food (link). The evidence suggests that distance from fast-food restaurant is a significant feature of childhood obesity. A study conducted by Janet Currie et. al (2009) has shown that among children in the 9th grade, a fast-food restaurant within 1/10 of the mile in school is associated with at least 5.2 percent increase in obesity rates (link). The study found that the direct impact of distance from the fast-food restaurant is significantly larger for less educated African-American and less educated women.

The question is whether taxing soda and other kinds of fizzy drinks could potentially reduce and/or reverse the growing trend of obesity. The basic question to start with, is what is the elasticity of demand for soda drinks. The estimates suggests that price elasticity of demand for the majority of soda drinks ranges from -0.8 to -1.0. For example, -1.0 elasticity coefficient suggests that a 10 percent increase in the price of soda would - ceteris paribus - lead to 10 percent decrease in soda drink consumption. The price elasticity of demand for soda drink is relatively high considering that coefficients of price elasticity of demand for other kinds of food ranges from -0.2 to -0.5. If policymakers considered the introduction of a tax on soda consumption, the relevant question is who would bear the burden of the tax? Given elastic demand, the tax would be beared by consumers. However, high price elasticity of demand suggests that there is a widely availible range of close substitutes with potentially negative adverse effects for the individuals. So it is not unlikely that children would switch to other kinds of fast food with equally negative impact on obesity, blood pressure and quality of living.

Given the lack of experiments and availibility of household surveys, it is difficult to estimate the consumer response to the introduction of tax on soda. The estimate of price elasticity of demand suggests that part of the tax would be beared by the consumer. However, it also suggests that a change in the relative price of soda would induce children to consume other varieties of fizzy drinks. Experimental studies by health policy experts suggests different approaches to tackling the adverse impact of soda drinks and other kinds of fast food. The most notable approach is the restriction of vending machines in school districts. However, restricting the access to vending machines would encourage the consumption of fast food outside school districts. A general tax on soda would be preferable to the restrictions of access of vending machines. There is absolutely no doubt that a tax would discourage consumption of soda and other kinds of fast food. Estimates suggest that soda and other kinds of fast food such as hamburgers, donuts and cakes are complementary. Assume, the cross-price elasticity of demand for burgers is -0.9 Thus, if the price per unit os soda increases by 10 percent, the demand for donuts, burgers and cakes decreases by 9 percent (0.9×10 percent). Since a tax on soda would raise the relative price of soda, the consumption of these kinds of fast food would diminish, resulting in less adverse impact of fast food consumption on the individuals. I would disagree with the statement that negative externalities from soda and fast food consumption are internalized by the individual. For example, an article by Trasande, Liu, Fryer and Weitzman (2009) published in Health Affairs (link) investigated the annual cost of childhood obesity in the U.S. between 2001 and 2005, based on the nationally representative data from U.S. hospitals admissions. The authors found that from 1999 to 2005, obesity-related hospitalizations doubled. In addition, costs related to hospitalization, treatment and diagnosis of obesity increased from $125.9 to $237.6 million, an 88.7 percent increase. The cost is partly beared by Medicare while the rest of the total cost is beared by the private insurance premiums.

Given the perverse system of employer-provided health care and implicit subsidizing of health insurance suppliers by the federal government, the periodic increase in obesity-related health care costs indicates a further rise in Medicare expenditures and health insurance premiums. In such conditions, there is little incentive for children and parents to reverse the consumption of soda drinks and fast food. Taxing soda and complementary fast food is a step in the right direction. But it should be noted that the introduction of a tax on soda should be compensated by a corresponding decrease in personal income tax. However, without the parent-guided awareness of the adverse impact of fast food on obesity, it would be difficult to reverse the increasing pattern and cost of childhood and adult obesity. Therefore, much of the obesity-related health care risk in childhood can be solved within the household. It would be irrational and foolish to believe that a tax on soda and government paternalism could solve the obesity puzzle and mitigate its neighborhood effects on bystanders.

Thursday, June 03, 2010

THE EUROZONE AS NON-OPTIMUM CURRENCY AREA

In WSJ, Vaclav Klaus, the president of Czech Republic, draw important conclusions from the long-term economic sustainability of the Eurozone (link), arguing that the eurozone is not an optimum currency area as suggested by the famous four criteria from economic theory. In a puzzling essay, Mr. Klaus demarks the eurozone as a monetary union of particular economic viability and, based on the assessment of growth dynamics in Europe, suggests that the eurozone will face a deepening problem in the future.

SLOW GROWTH AND PUBLIC DEBT IN EUROPE

Gary Becker (link) and Richard Posner (link) have initiated an interesting debate on low economic growth as the main macroeconomic concern of European economies in overcoming the increasing burden of public debt.

Saturday, May 22, 2010

TAX WEDGE AND PRODUCTIVITY IN OECD COUNTRIES

The OECD Factblog highlighted a comparison of tax burden across the OECD countries. The main findings of the comparison is that overall tax burden, measured as a percentage of labor costs, is the highest in Western European countries. Belgium, Hungary, Germany and France are the countries with the highest overall tax burden while Ireland, Iceland, Australia and Korea have sustained low tax wedge. The data acquired by the OECD pose an intriguing question: is slow economic growth in European countries attributed to high tax burden of labor supply and, if so, has the gap between the U.S. and Europe grown further?

Let's decompose the data and underline the main findings. Tax wedge, measured as a percentage of taxes and transfers paid in the share of total labor costs, is a suficient measure of the overall level of taxation. In the analysis of the effect of taxation on labor supply, the economic theory distinguishes between substitution and income effect. The former means that tax rate on labor supply would reduce the number of working hours and shift the individuals to allocate more time into leisure. The income effect, on the other hand, states that the effect of tax on labor supply would be neutral and would, hence, not have an effect on the relative allocation of resources between working hours and leisure. In general, there are two largely opposing views in economic policy regarding the relationship between taxation and labor supply. Conservative and liberal economists tend to emphasize the role of incentives. Higher tax rate would raise the labor cost and the corresponding decline in wages would be offset by the re-allocation of resources into leisure sector of the economy. Left-wing economists mostly disagree with the abovementioned proposition. Instead, they emphasize the role of elasticity of labor supply. According to New Keynesian view, short-run tax elasticity of labor supply is low in absolute terms, meaning that the amount of working hours does not respond significantly to relative changes in tax rates. The Keynesian economists thus emphasize the significance of income effect while the conservative and liberal economists tend to emphasize the substitution effect. The distinctions and policy effects of these two theoretical propositions remains a controversial issue of economic policy debate.

The country distribution data is extensively underlined in the data (link). For example, one-earner married couple at 100 percent of earnings distribution is taxed at 20 percent of the overall labor cost in the United States, 22 percent in Australia, 18 percent in Switzerland and 13 percent in New Zealand. On the other tax wedge statistics for Western Europe is a completely different picture. In Sweden, one-earner married couple at 100 percent of earnings distribution will earn only 57 percent of net earnings, indicating a 43 percent effective tax rate on labor supply. In Belgium, the effective tax rate on labor supply is 42.6 percent. Is the difference in effective tax rates statistically significant feature of productivity variation across OECD countries. The OECD recently composed a breakdown in key productivity statistics in developed countries (link). To estimate the relationship between productivity and tax burden, I collected data on multifactor productivity dynamics from Groningen Growth and Development Center (link) and data on tax wedge across OECD countries (link). I estimated the noted relationship for 16 developed OECD countries. Multifactor productivity is a dependent variable while tax wedge is an explanatory variable.The estimates are displayed on the graph below.

Multifactor productivity in OECD relative to the U.S. and total tax burden (% of labor cost)

Source: GGDC, OECD Factblog

The horizontal line on the graphs marks the U.S. level of multifactor productivity. As the graph shows, the underlying relationship between multifactor productivity (MFP)and tax wedge is fitted with quadratic equation. Total tax wedge explains about 34.5 percent of the variation in multifactor productivity index across OECD countries. The trend exerts a decreasing MFP as the tax wedge rises and, after reaching a local minimum, a slight increase alongside the proporional rise in tax wedge. The relevant question is at which rate of tax wedge the MFP reaches the minimum. Setting the first-order derivate to zero (dy/dx=0) yields 0.0016x-0.0488=0. Rearranging the equation yields x=30.5. The first-order derivative implies that MFP reaches the minimum at 30.5 percent tax wedge. The estimate sample-based tax elasticity of productivity ((dy/dx)(x/y)) is 1.78. The elasticity indicates that 1 percentage point increase in tax wedge would reduce the multifactor productivity in a sample country by 1.78 percent, ceteris paribus. In other words, the estimated slope coefficient suggests that a 1 percentage point increase in tax wedge would widen the MFP gap between the average country and the US by additional 0.05 index points.

In economic terms, MFP would decrease as long as the countries in the sample would exert less than 30.5 percent tax wedge. In the horizon after the local minimum (30.5 percent), MFP would initially increase but at a smaller rate than before the function would reaches the minimum point. At 20 percent tax wedge (close to Japanese level), the expected decrease in MFP would be 0.0168 index point. At 40 percent tax wedge, the expected increase in MFP would be 0.0152 index point. Economically, the relationship between MFP and tax wedge should not be interpreted as a mixed effect of tax wedge on MFP. In countries, where tax wedge exceeds 30.5 percent (Austria, Denmark, Sweden, Belgium etc.) , the multifactor productivity is close to the U.S. level. The only country with higher MFP level than the United States is Luxembourg. In these countries, the average number of annual hours worked per worker is lower than in the U.S. Hence, hourly productivity output is higher. The following graph illustrates the relationship between annual hours worked (per worker) and MFP level.

Average annual hours worked per worker and multifactor productivity relative to the US
Source: OECD Statistics (2010)

As the graph illustrates, there is a negative relationship between average annual hours worked and MFP. The estimated regression coefficient suggests that an increase in annual hours worked by 100 hours would reduce MFP level (compared to the U.S) by 0.06 index points. As expected, the implied elasticity of productivity is negative. Taking the average values ov both variables, an increase in average annual hours worked (per worker) by 1 percent would reduce the MFP relative to the U.S level by 1.16 percent, ceteris paribus.

The conclusion is that there is a significant and negative impact of tax wedge on multifactor productivity. Taking the differences in annual hours worked into account, tax wedge alone explains almost 35 percent of the differential in multifactor productivity across the OECD. The findings suggest that there is a relatively strong substitution effect in labor supply. The finding is underlined by the fact that higher tax wedge would correspondingly reduce annual hours worked. However, the interpretation should be taken with a grain of warning. As previous empirical studies have shown, there is a widespread disparity in the distribution of working hours in formal and household sector of the economy. A sizeable proportion of working hours in household sector of the economy is not officially measured. Consequently, a blick of distortion of the real relationship between labor supply and tax wedge, in its broadest sense, is a major impediment to the measurement of labor supply dynamics. These estimates will, in a large part, determine the future research of the effect of taxation on labor productivity.

Tuesday, May 11, 2010

WELFARE STATE AND THE FUTURE OF EUROZONE

The $140 billion rescue package to Greece is a milestone in the European Monetary Union. A lively debate on recent macroeconomic imbalances in the weakest economies of the Euroarea - Greece, Italy, Spain and Portugal - in the Eurozone has reopened the old debate on whether the Eurozone is an optimum currency areas (here, here, here and here). The idea of optimum currency areas was first proposed by Nobel-winning economist Robert Mundell. In general, if several countries form a currency union, they should have at least four common macroeconomic features as essential framework of the currency union. In this article, I'll review the labor market criteria and fiscal adjustment criteria in the light of a recent imbalances in the Euroarea, and leave production diversification and export criteria for future discussion.

First, there should be a high degree of labor mobility between countries in the currency union. The basic idea behind the labor mobility criteria is that the lack of labor mobility triggers divergence of productivity growth rates and asymmetric adjustment of wages. If inter-country productivity divergence persists, there is an upward pressure on wages adjustment given the lack of exchange rate adjustment since the countries share a common monetary policy. The formation of the currency union in the United States was relatively straightforward given the fact that labor mobility between the states is very high. In Europe, the level of labor mobility is relatively low. The lack of labor mobility has a lot to do with labor market institutions in European countries. Workers from the European periphery can hardly move to Germany, Netherlands or Denmark as they do not speak the same language. The lack of inter-country mobility resulted in significant wage premiums and rise in rents since European labor markets share a pretty high degree of monopoly power since European workers can't switch easily between labor market structure. The resulting outcome of the lack of labor market competition was a significant "union capture" of the labor market, leading to rigid wage determination and high market switching costs.

Paul Krugman recently argued (link) that the major problem behind the European Monetary Union is the lack of common fiscal policy. To a very large extent, the absence of common fiscal policy seriously affects the future prospects of the European Monetary Union. Common fiscal policy could easily absorb asymmetric shocks withing the Euroarea. However, instituting the policy could not alter the trade-off between fiscal autonomy and asymmetric shock intensity. In other words, the main problem of the Euroarea right now is the free-riding of Eurozone's most problematic countries on a common monetary policy using disrectionary fiscal policy. Before the economic crisis, Spain had a budget deficit while, at the moment, the 2010 budget deficit forecast is more than 8 percent of the GDP. The estimate Greece's balooning public debt in 2009 ranges from 110 to 115 percent, depending on the consensus forecast. If the EMU countries unified a fiscal policy, the countries would not have an incentive to free-ride on discretionary fiscal policy and further increase the stock of public debt. The major impediment on the recovery and long-term economic outlook of Eurozone countries is largely dependent on how these countries will reform the pension systems in the light of a growing old-age dependence and a near fiscal insolvency of the pay-as-you-go (PAYG) pension schemes. It will be impossible to reverse the aging population and its persistent pressure on an increasing public debt. The integration of fiscal policy would require a sizeable harmonization of taxes given high costs of coordination and sufficient incentives for moral hazard. Without the reversion of long-term public debt pressure from aging, discretionary spending and entitlements, countries such as Greece, Spain and Portugal would leave the Eurozone.

Tuesday, May 04, 2010

THE EMPIRICS OF CORRUPTION, INSTITUTIONS AND ECONOMIC DEVELOPMENT

Urska Zagar posted two very interesting empirical articles (here and here) about the connections between corruption, economic freedom and economic welfare. The first two indicators are qualitative while the third one is rather easily measurable. In a sample of 50 advanced, developing and least developed countries, she found a positive and robust correlation between corruption perception and GDP per capita, meaning that higher GDP per capita, on average, reduces the scope of corruption. The relationship between corruption and economic development is in fact even more intriguing than empirical figures suggest.

The impact of corruption on economic growth is an important theoretical and empirical theme in the economic literature. In this theoretical and empirical post, I will briefly review the main literature on corruption and development and discuss the empirical studies.

I would firstly refer to the article by Rodrik, Subramanian and Trebbi (2002) where the authors discuss the primacy of institutions for economic development over the exogenous factors such as geography (link). There has been an extensive amount of literature on the role of geography in economic development. The empirical strategy is quite simple. Usually, the basic equation includes the list of explanatory variables such as distance from equator, the percentage of land used for agricultural production and so forth. For example, the basic equation might take the following form:

log(GDP)=b1+b2(Dist)+b3(Land)+b4(Dummy_SubAfrica)+e

where GDP stands for GDP per capita, Dist for distance from equator, Land for the percentage of fertilized land and Dummy_SubAfrica is a dummy variable, taking the value of 1 if a country is located in the Subsaharan Africa and 0 if otherwise. In addition, e represents stohastic error unexplained by the selected predictors.

However, the basic problem with geographic approach to explaining economic development is that the approach does not, by itself, distinguish between the endogenous features of economic development. In regressing GDP per capita on the distance from equator, the empirical estimates usually result in a modestly negative correlation between the two variables. However, the distance from the equator cannot itself explain the nature of economic development and its significance over time mainly because of its low predictive power in explaining the evolution of institutions and governance.

An interesting approach has been incorporated by Acemoglu, Johnson and Robinson (2001). They incorporate a historical and institutional perspective in the empirical framework of the explanation of economic development. The authors used mortality rates of colonial settlers to explain the institutional quality. They further argue that where settlers encountered few health hazards compared to European settlement, they established solid institutions, strong enforcement of property rights and a robust system of law. In other areas where health hazards frequently occured, colonizers focused on the extraction of natural resources and showed little or no interest in building high-quality institutions. Rodrik, Subramanian and Trebbi (2002) further estimated the impact of geographic variables, institutions and openness on macroeconomic variables.

The main findings in their study were the following. First, each degree distance towards equator, on average, reduces the income per capita by 0.94 percent. The geographical location by the equator is also negatively related to capital per worker (-1.68), human capital per worker (-0.25) and total factor productivity (-0.32). Second, the quality of institutions is a very good measure of the economic welfare. In their panel, the authors found that each additional improvement in the rule of law, on average, leads to 2.22 percent increase in income per capita. The result is statistically significant at 1 percent. The improvement of institutional quality is both positively related and statistically significant when capital per worker, human capital per worker and total factor productivity are regressed on the institutional quality.

Back in 1997, Peterson Institute published an extensive study, searching the causes of corruption (link). The author estimated that the highest cost of corruption in regressing a series of macroeconomic variables on corruption index is lower education expenditure and a decrease in private investment. The estimate of the total macroeconomic cost of corruption is a difficult and daunting empirical task.

The main causes of corruption are mostly endogenous and related to the institutional evolution ranging from legal origins, colonial historical variables to the public sector efficiency variables. In search of the grain of truth, it should be noted that capturing the stylized effect of corruption of economic growth and development requires an interactive empirical approach. In other words, it would be impossible to establish "cause-and-effect" connection between corruption and development indicators without extracting a large amount of historical data and regressing it on the key endogenous variables.

Clearly, the role of geographical characteristics should not be neglected. However, the primacy of institutions in explaining the contemporary patterns of economic development is rather undisputable. Daron Acemoglu recently wrote an in-depth article on the distribution and explanatory factors regarding world poverty (link) where it clearly stressed the lack of institutions of human capital in the evolution of world poverty. When discovering the true causes of corruption, there should nonetheless be a clear and distinct rationale underlined by the evolution of institutional quality over time as the most significant measure in explaining the evolution, causes and effects of corruption on economic development.

Sunday, May 02, 2010